Bitcoin and Ethereum are off to their weakest start to the year in over a decade. The combination of tariff plans, geopolitical turmoil, technology shocks, ETF outflows and historically weak sentiment indicators mean that many now see this as a new phase in the Bitcoin cycle.

Sources: Ainvest, AOL, CNBC, CryptoNews, Mexc, Phemex, Stocktwits and Kaupr Today
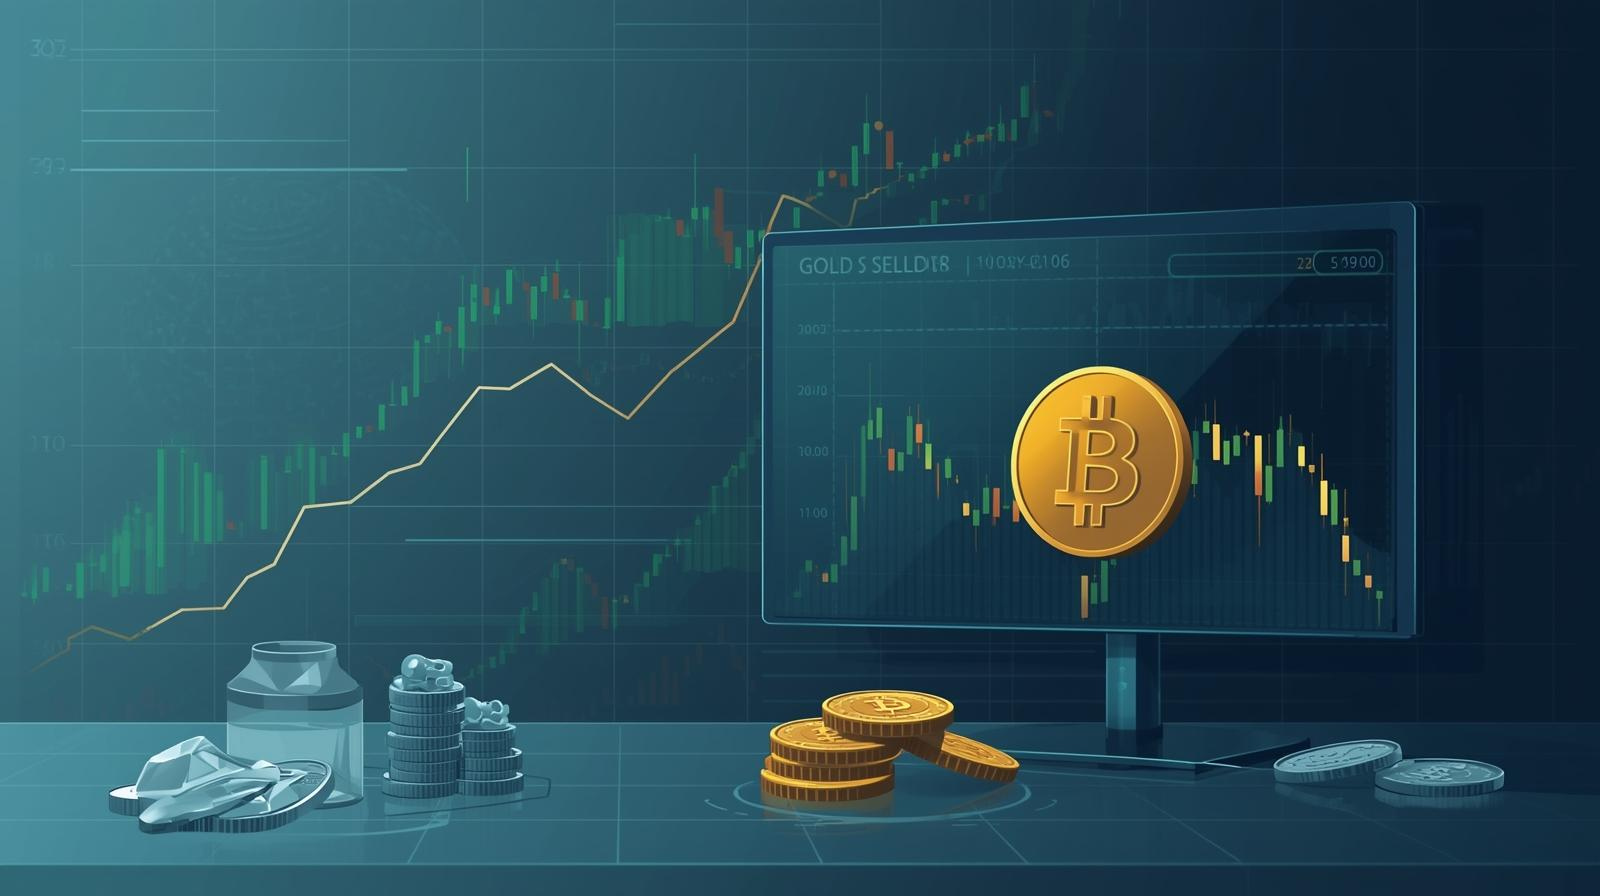
At the start of the week, investors faced a Bitcoin market marked by falling prices, low liquidity and unusually gloomy mood. After record levels towards the end of 2025, Bitcoin has slid down to the low-to-mid 60,000 range, while Ethereum is down around a third since the New Year. At the same time, the S&P 500 has barely crept weakly into plus, and gold has delivered a marked upswing, creating a clear distinction between crypto, which has fallen sharply so far this year, and key indices and commodities, which have performed better.
Fortune's review of price data from CoinGecko shows that both Bitcoin and Ethereum are now in their weakest year-to-date performance since the data base began more than a decade ago. Bitcoin is down around 24 percent since the turn of the year to the range around $60,000—65,000, while Ethereum has fallen about 34 percent to around $1,800—2,000. At the same time, the S&P 500 is up about 0.4 percent and the Dow Jones about 2.3 percent, while gold has risen about 17 percent and silver about 14 percent over the same period. For readers who see crypto as part of a broader portfolio, that means the start of 2026 is so far a period in which crypto clearly underperforms both stocks and classic “safe haven” assets.
On the macro side, several events have helped shape this phase. Plans by President Donald Trump to raise global tariffs to 15 percent have created new uncertainty around trade and growth, and sparked an apparent risk sell-off in Bitcoin although some stock markets remained relatively stable. At the same time, heightened military tension around Iran has raised the risk of a conflict that could disrupt global trade flows and oil prices, making it harder to interpret Bitcoin unambiguously as the “safe haven” in the snapshot.
In addition, the market has received a technology shock from another edge: IBM experienced its weakest market day in 25 years after Anthropic launched AI capabilities that can automate the modernization of banking and Cobol systems. The fall in IBM contributed to a broader risk sell-off that also hit crypto, illustrating how AI‑driven technology change is now playing into the valuation of both traditional tech‑companies and digital assets.
Behind the price movements lies a pattern in which larger players appear to have reduced their exposure over the period. CryptoNews data shows that realized losses for fresh Bitcoin buyers reached levels of over $1.2 billion per day at the worst, before falling back to around half a billion dollars — a level typical in phases where many short-term positions have been forced out. At the same time, exchange deposits from large addresses have remained at high levels, with around two-thirds of the inflows to exchanges related to the ten largest deposits during the period.
The spot ETFs paint a related picture. Over a five-week period, close to $3.8 billion has been withdrawn from US spot Bitcoin ETFs, the longest continuous withdrawal period since February 2025. BlackRock's iBIT fund alone has seen about $2.13 billion in redemptions over the same period. The wave of withdrawals shows a sustained institutional caution following the price fall last autumn and that many professional players are currently choosing to step down risk in regulated products rather than increase exposure at lower levels. For listed companies with large Bitcoin positions, this phase involves significant unrealized fluctuations in their balance sheets.
Sentiment indicators show that the market is in an unusually strong fear phase. Phemex reports that the Crypto Fear & Greed index has fallen to “extreme fear,” at levels lower than both during both the Covid crash and the FTX collapse. Historically, such readings have often been associated with periods in which short-term players are retreating, while longer-term players are reconsidering their positioning.
On-chain analysis also points to risk measures such as Bitcoin's Sharpe ratio falling to levels previously seen around cycle lows in 2015, 2019 and 2022. In the current situation, the same data points are used for different interpretations: for some, they are primarily an expression of how vulnerable the market is to further downside; for others, they illustrate that a lot of negative information has already been priced in. In sum, this is a phase in which numbers and curves become largely a matter of interpretation, depending on the time horizon and willingness to risk.
In this landscape, there are still profiled voices choosing to increase their exposure. Robert Kiyosaki, author of “Rich Dad Poor Dad,” recently said he bought one Bitcoin for $67,000, while referring to the market as “crashing.” His rationale is a familiar macro narrative: high and growing US government debt, rising interest rates and an expectation that, in the long term, central banks will have to resort to more money printing. In this perspective, Bitcoin, with its cap of 21 million coins, is described as a digital parallel to gold and silver.
Kiyosaki has also raised aggressive long-term price expectations for both Bitcoin, gold and silver, pointing to the year 2140 — when all Bitcoin is scheduled to be mined — as a symbolic end line for the scarcity story. For readers considering their own exposure, this primarily illustrates that there are significant differences in how the same data is read: where some actors interpret the period as an argument for reducing risk, others see it as part of a long-term macro story in which digital scarcity assets take on a more obvious role.
Overall, the current phase is characterised by the combination weakest year start in over a decade, evident institutional scepticism, high realised losses and mood of “extreme fear.” Several analysts point to the risk of further downside if the $60,000-$65,000 area does not hold as a support zone, among other things due to weak order books, ETF outflows and an environment where relatively small news can create large outflows.
At the same time, it is precisely during these periods that previous Bitcoin cycles have gone through their most demanding but also most formative phases — with months marked by red prices, low volume and a high degree of disagreement about the way forward. How this phase develops further will therefore say a lot about how robust demand for Bitcoin is as macro, regulatory, technology and market psychology pull in different directions — and whether the current situation will be described in retrospect as an extension of a bear market-like period, or as part of a longer build-up towards the next chapter in Bitcoin's history