


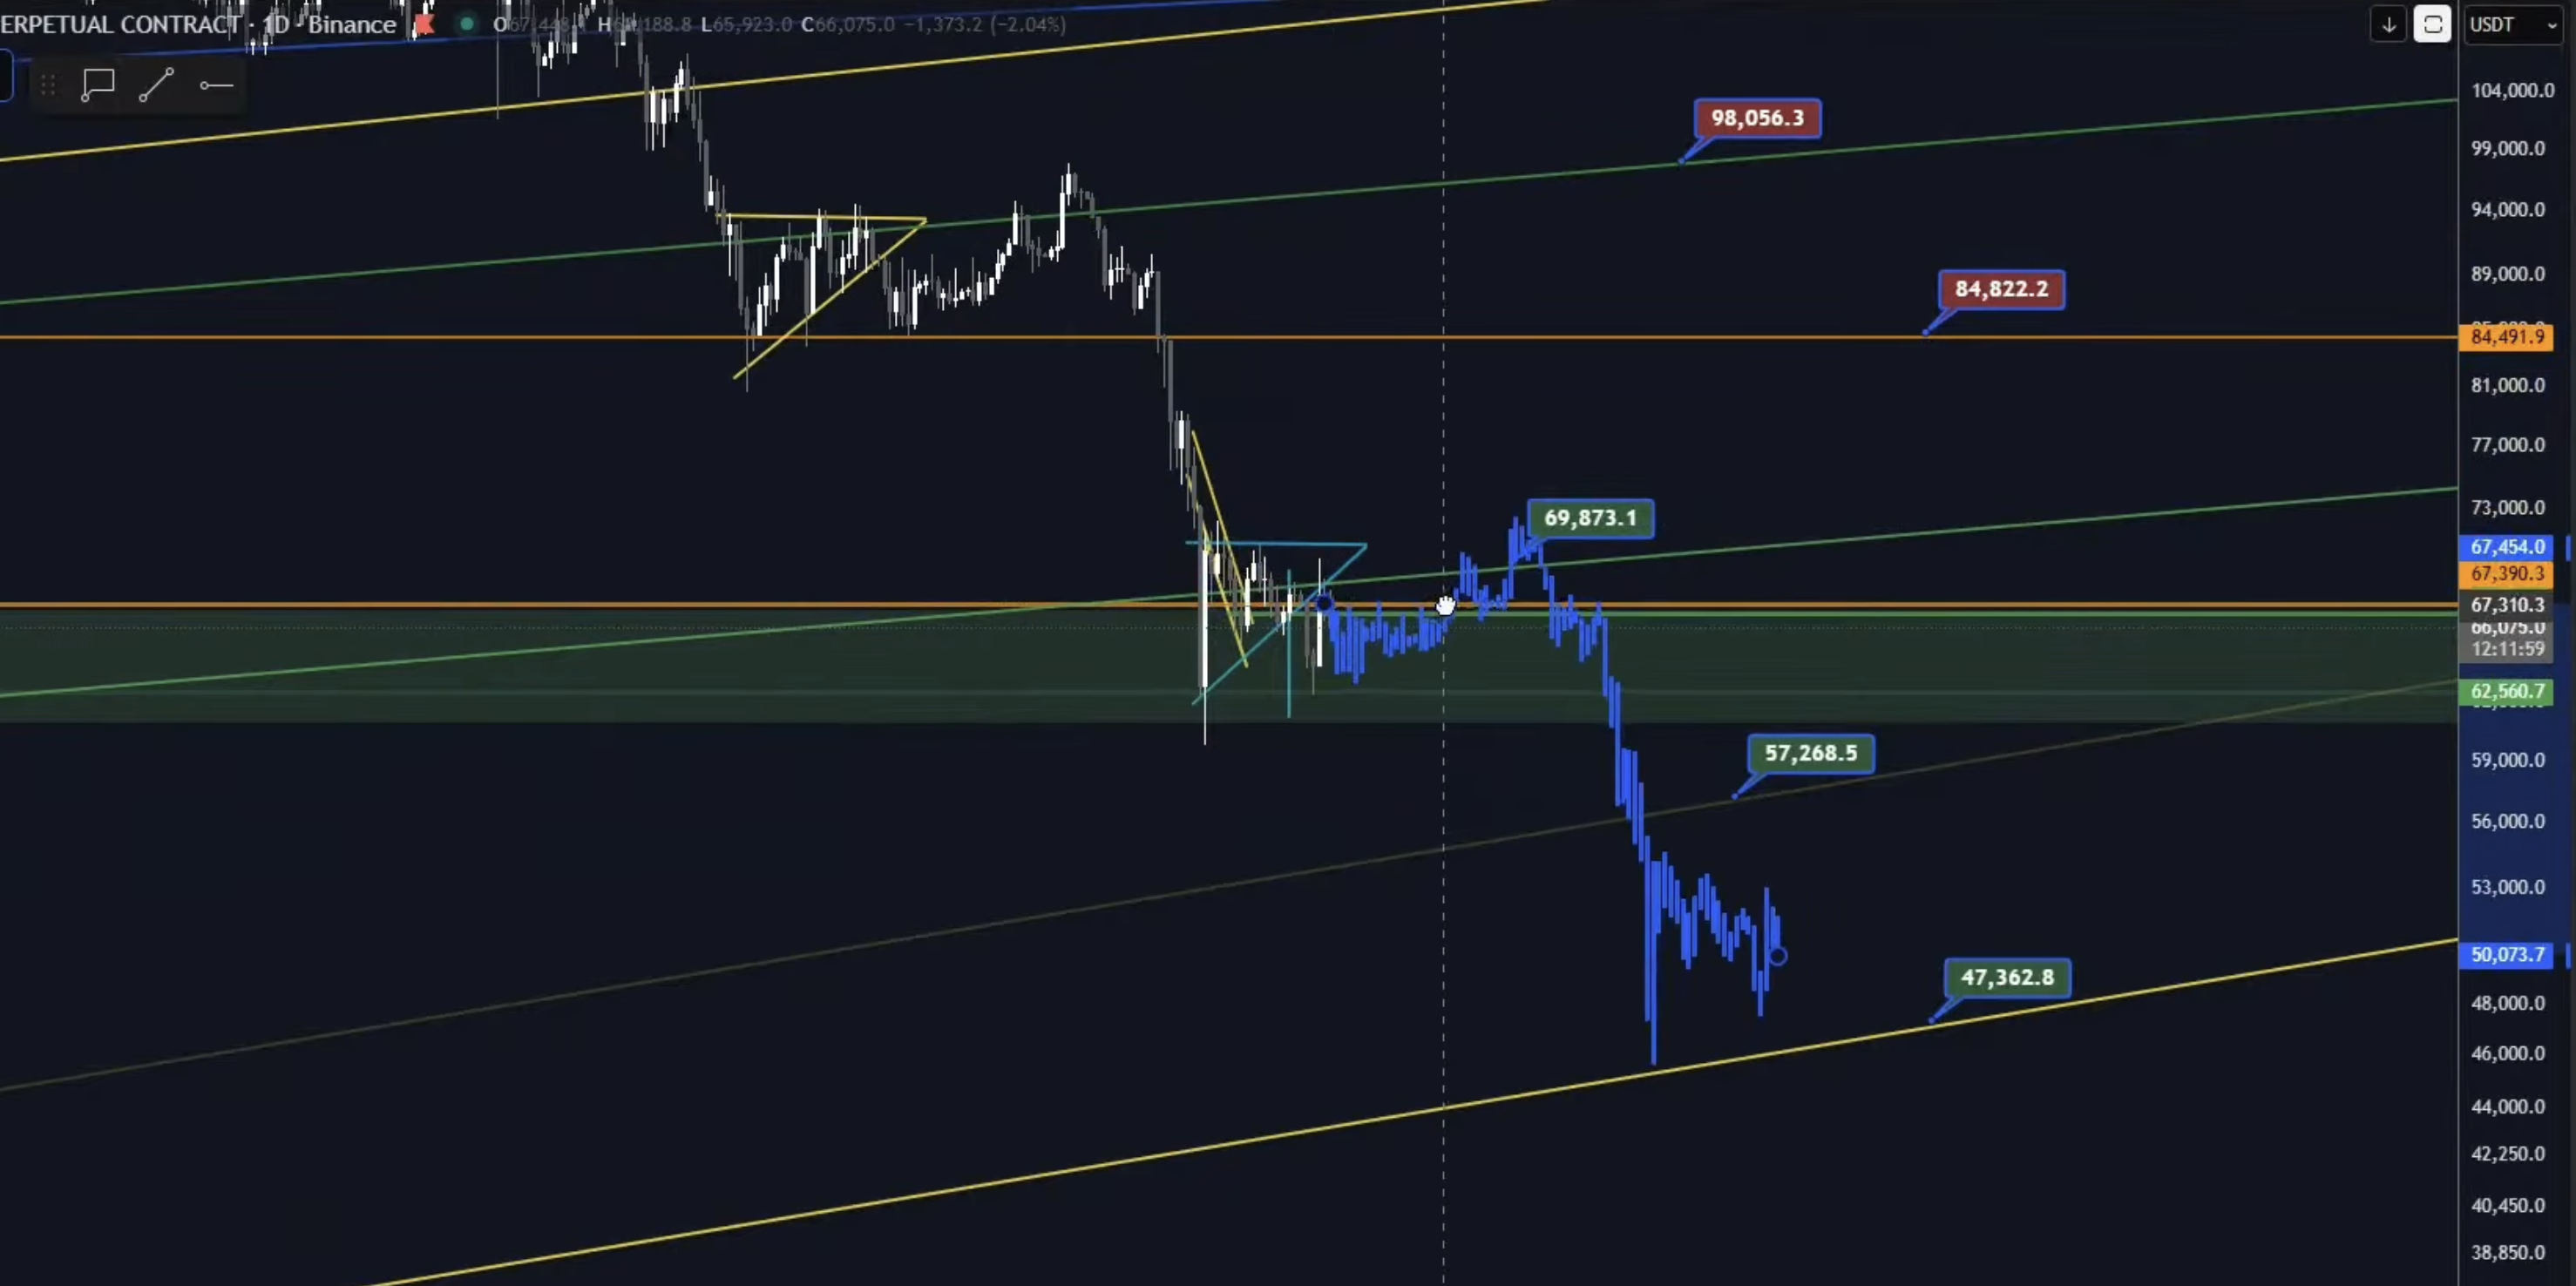
Back on February 27, during a Kaupr Live session, I shared a possible roadmap for how Bitcoin could develop over the months ahead.
The analysis was never intended as a precise price prediction. Instead, the idea was to identify the key technical areas that could become relevant if Bitcoin's weakening market structure developed into a broader correction.
Several months later, that roadmap has provided a useful framework for following the market.
Bitcoin eventually traded into the $57,000 region, testing an area I had highlighted as one of the most important long-term support zones on the chart.
Graf: TradingView
Since then, however, something important has changed.
For the first time in months, Bitcoin is now beginning to show signs that the broader technical structure may be improving.
In February, Bitcoin was trading within a weakening structure following the previous advance.
The market subsequently revisited several of the areas highlighted in the original analysis. Bitcoin reclaimed the region around $69,800, later tested the $84,000–85,000 area, and eventually rotated lower toward the major support region around $57,000.
What mattered throughout this process was not whether Bitcoin followed a predetermined line on a chart candle for candle. Markets rarely behave that way.
The purpose of the roadmap was to identify the areas where the market was most likely to reveal something meaningful about its underlying structure.
The $60,000 region ultimately became one of those areas.
Bitcoin found support there and, rather than continuing immediately lower, began establishing a series of higher lows and higher highs.
That development has gradually changed the technical picture.
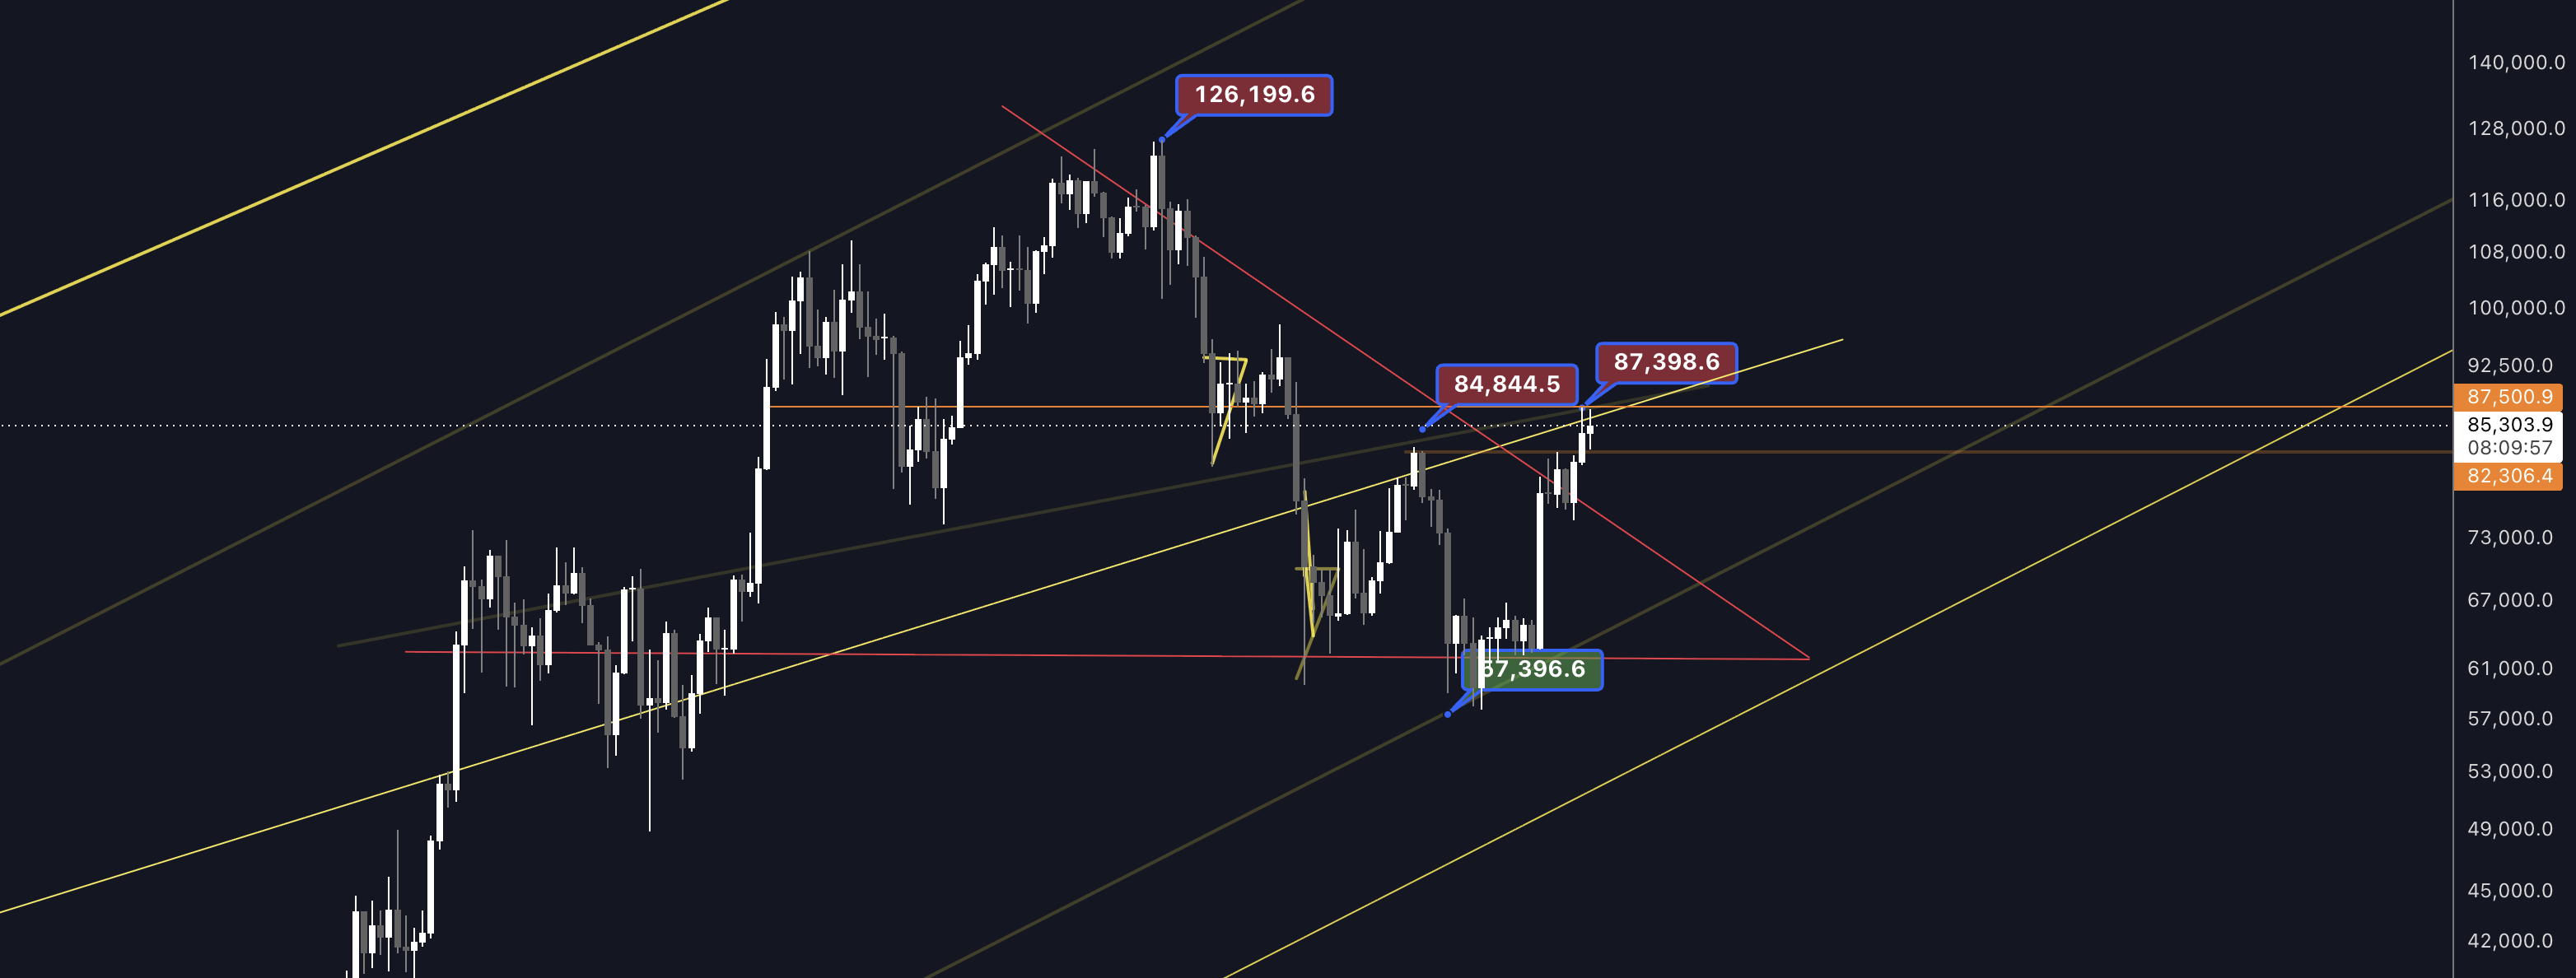
Bitcoin's recovery from the $57,000 region has now pushed the market back above several technical levels that I consider important.
Price has moved back above the 200-day moving average and the 50-week moving average, while the shorter-term structure has transitioned toward a sequence of higher highs and higher lows.
Perhaps more importantly, Bitcoin also appears to have broken above the descending trendline that had capped price throughout much of the correction.
Graf: TradingView
Taken together, these developments suggest that the market is no longer behaving in the same way it was several months ago.
But there is an important distinction between an improving structure and a confirmed larger breakout.
Bitcoin still has work to do.
The next major test on my chart sits around $87,500–88,000.
This region has previously acted as an important horizontal level, and Bitcoin is currently trading beneath it despite the recent improvement in momentum.
That makes the present setup particularly interesting.
On one hand, Bitcoin has broken the descending trendline, reclaimed important moving averages and continued to establish higher highs. Those are constructive developments compared with the structure we were looking at earlier this year.
On the other hand, the market has yet to convincingly reclaim the resistance sitting around $87,500.
For me, this means the breakout should not be viewed in isolation.
A sustained move above this region would provide additional confirmation that the recovery is developing into something structurally larger. Until then, the possibility of rejection remains relevant.
Going into the coming weeks, the market has several clearly defined areas worth monitoring.
The first is the $87,500 resistance. A convincing reclaim would represent another significant improvement in the broader structure and shift attention toward higher resistance levels.
Below the market, the $76,800 region now becomes increasingly important. This area sits close to the recent breakout structure and could provide an early indication of whether buyers are capable of defending the move.
Further below, the region around $75,500 remains another important structural level.
The market therefore finds itself in an interesting position: the technical picture has improved considerably from the lows, but Bitcoin is now approaching the point where that improvement needs to translate into a sustained break of resistance.
That distinction will be one of the main things I am watching.
This article also marks the beginning of something new.
Going forward, I will be writing Trendline, a weekly technical analysis of the Bitcoin market here on Kaupr, where I will follow the technical structure of the market and revisit the levels and scenarios discussed in previous editions.
I have followed and traded the cryptocurrency market for several years, with much of my approach centred around market structure, support and resistance, trendlines and longer-term technical levels.
Rather than trying to predict where Bitcoin will trade next week, the objective of Trendline will be to build a continuous framework around the market: what has changed, which levels matter now, and what would need to happen for the broader picture to change.
Some weeks that may mean discussing a breakout. Other weeks it may simply mean that nothing meaningful has changed.
That, in itself, can be valuable information.
The Bitcoin chart today looks considerably different from the one we were analysing earlier in the year.
The support around $57,000 held. The market subsequently began producing higher highs and higher lows. Bitcoin has reclaimed important moving averages and appears to have broken the descending trendline that defined much of the correction.
Those developments make the current structure increasingly constructive.
But the market is now approaching another important test.
The area around $87,500 remains resistance, and until Bitcoin can establish itself above that region, I believe it is worth separating the recent breakout from confirmation of a broader trend reversal.
Technical analysis is not about knowing what happens next.
It is about identifying the levels that matter, observing how price behaves when it reaches them, and updating the framework as the market provides new information.
That is exactly what I will be doing here each week.

Venkat Hrushikesa Varri has followed the crypto and financial markets for several years, with a particular interest in technical analysis and market development. He is part of the Kaupr team, covering Norwegian and international crypto conferences and contributing live coverage and content from the industry. His interest in market analysis has also grown into a separate project: an analysis platform for the crypto market, now approaching launch, which aims to make market analysis and data-driven insights more accessible to crypto investors. Through Trendline, Venkat shares his own observations and analyses of the market, focusing on trends, market structure and the technical levels that may matter going forward.
Trendline is Kaupr's weekly technical analysis of Bitcoin and the crypto market, published every Monday. Each edition follows the market structure from week to week: which levels matter now, what has changed since the last edition, and what would need to happen for the broader picture to change.
Trendline is analysis, not investment advice, and is not a recommendation to buy or sell any asset. The views are the author's own.