


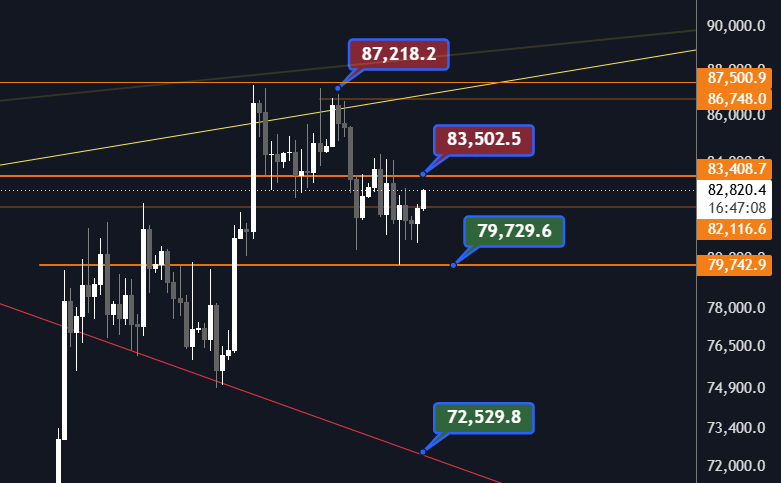
Last week, I highlighted $83,500 as the near-term pivot for Bitcoin after price rejected from the $87,000 region. Holding that level would have kept the possibility of another attempt at resistance alive, while losing it would weaken the short-term picture.
Since then, Bitcoin has moved below $83,500 and returned towards the area of the previous May high around $82,200. At the same time, sellers have not been able to push price convincingly below the recent wick low near $79,700.
That leaves Bitcoin between two increasingly clear levels.
Rather than establishing a new directional move, the market appears to be consolidating between approximately $79,700 and $83,500. Until one side of that range gives way, the next few sessions may tell us more about where Bitcoin is building liquidity than where it is ultimately heading.
Graf: TradingView$83,500 Is the Near-Term Pivot
Bitcoin’s broader recovery from the lows remains important context.
Price recovered strongly, broke above the descending trendline that had defined much of the previous correction and eventually moved above the May high around $82,200. That improvement in structure opened the possibility of a larger recovery.
Bitcoin subsequently reached the $86,750–$87,500 resistance region highlighted in previous editions of Trendline.
But the important development since then is what didn’t happen.
Buyers were unable to establish price above that resistance or continue the sequence higher. Bitcoin instead rejected from around $87,000, moved sharply lower and has now returned below the $83,500 pivot.
That makes the move above the May high less convincing in hindsight. Rather than immediately developing into a sustained breakout, Bitcoin has returned towards the area from which the latest leg higher began.
It does not necessarily mean the broader recovery has failed. But it does mean the bulls have so far failed to confirm the breakout with continued strength.
The daily chart now gives us two relatively clear boundaries.
The upper boundary sits around $83,500, the level that previously acted as an important near-term pivot.
The lower boundary is around $79,700, corresponding with the recent wick low where buyers previously stepped back into the market.
Bitcoin is currently trading between those levels.
That makes the area between approximately $79,700 and $83,500 the main range I am watching going into the new week.
This could also mean that the next phase of the market is less eventful than the previous one. After the sharp move towards $87,000 and the subsequent rejection, Bitcoin may need time to consolidate before either buyers or sellers regain enough momentum to establish direction.
In that environment, movement inside the range is less important than what happens at its boundaries.
The recent wick around $79,700 is now particularly important.
Bitcoin traded into that area during the latest sell-off but recovered rather than establishing itself below it. As long as that low continues to hold, sellers have not yet confirmed another significant leg lower.
A daily close below approximately $79,000–$79,700, however, would change the picture.
That would create stronger evidence that the current range is resolving to the downside and weaken the near-term structure further.
The distinction between another wick below support and sustained acceptance below it will therefore matter. A brief move through the level followed by another recovery would carry a different implication from Bitcoin closing below the range and continuing lower.
For now, that confirmation has not happened.
The bullish side of the equation is similarly straightforward.
The first task is reclaiming $83,500.
Moving back above that level and establishing support there would put Bitcoin back above the upper boundary of the current range and improve the short-term structure.
Beyond that, the larger test has not changed.
The region around $86,750–$87,500 remains the resistance area that stopped the previous advance. Even if Bitcoin reclaims $83,500, the market would eventually need to challenge that region again before a larger bullish continuation becomes convincing.
Until then, the move to $87,000 remains a failed attempt at continuation rather than confirmation of a new leg higher.
For the coming week, I am primarily watching the $79,700–$83,500 range.
A daily close below the lower boundary would strengthen the bearish case and shift attention towards lower areas of support.
A reclaim of $83,500 would instead suggest that buyers are regaining control and could put the $86,750–$87,500 resistance region back into focus.
But there is a third possibility that should not be overlooked: neither happens immediately.
Bitcoin could simply continue consolidating inside this range while both sides wait for stronger confirmation. After several weeks of relatively large moves, a quieter period of price action would not be unusual.
The objective, therefore, is not to predict every movement inside the range. It is to watch for evidence that one side has actually taken control.
Bitcoin’s price structure is only one part of the broader crypto market.
In upcoming editions of Trendline, I will also begin looking beyond the Bitcoin chart to build a more complete picture of market conditions.
That will include graphs such as TOTAL2 and TOTAL3, which can help assess how capital is behaving across the crypto market outside Bitcoin, alongside Bitcoin dominance and other broader market structures.
Looking at these together can provide additional context around whether strength is concentrated primarily in Bitcoin or beginning to spread across the wider market.
So keep an eye out for upcoming editions of Trendline, where the analysis will gradually expand beyond Bitcoin’s individual price chart.
The move towards $87,000 gave Bitcoin an opportunity to extend the recovery above the May high, but buyers were unable to sustain it.
Price has since returned below $83,500 and towards the previous breakout area, while the recent low around $79,800 continues to hold.
That leaves Bitcoin in a relatively straightforward position heading into the new week: $83,500 above, $79,700 below.
Between those levels, consolidation may continue.
Outside them, the market begins to give us new information.
A reclaim of $83,500 would strengthen the case for another attempt higher. A confirmed daily close below the recent wick low would instead weaken the structure and increase the probability of further downside.
Until either happens, patience may be more useful than trying to anticipate which side ultimately wins.

Venkat Hrushikesa Varri has followed the crypto and financial markets for several years, with a particular interest in technical analysis and market development. He is part of the Kaupr team, covering Norwegian and international crypto conferences and contributing live coverage and content from the industry. His interest in market analysis has also grown into a separate project: an analysis platform for the crypto market, now approaching launch, which aims to make market analysis and data-driven insights more accessible to crypto investors. Through Trendline, Venkat shares his own observations and analyses of the market, focusing on trends, market structure and the technical levels that may matter going forward.
Trendline is Kaupr's weekly technical analysis of Bitcoin and the crypto market, published every Monday. Each edition follows the market structure from week to week: which levels matter now, what has changed since the last edition, and what would need to happen for the broader picture to change.
Trendline is analysis, not investment advice, and is not a recommendation to buy or sell any asset. The views are the author's own.