


Bitcoin tested both sides of the range this week, but neither buyers nor sellers managed to take control. Meanwhile, Ethereum is approaching a trendline that has supported its recovery since May.
Last week, the key question was whether Bitcoin's support was developing into a base or simply providing a temporary pause before another move lower.
One week later, the market still hasn't given us a definitive answer.
Bitcoin spent another week trading around the same range highlighted in the previous Trendline. There was volatility, and both sides attempted to take control, but neither attempt developed into a sustained breakout.
That leaves Bitcoin almost exactly where it started: inside the range and waiting for confirmation.
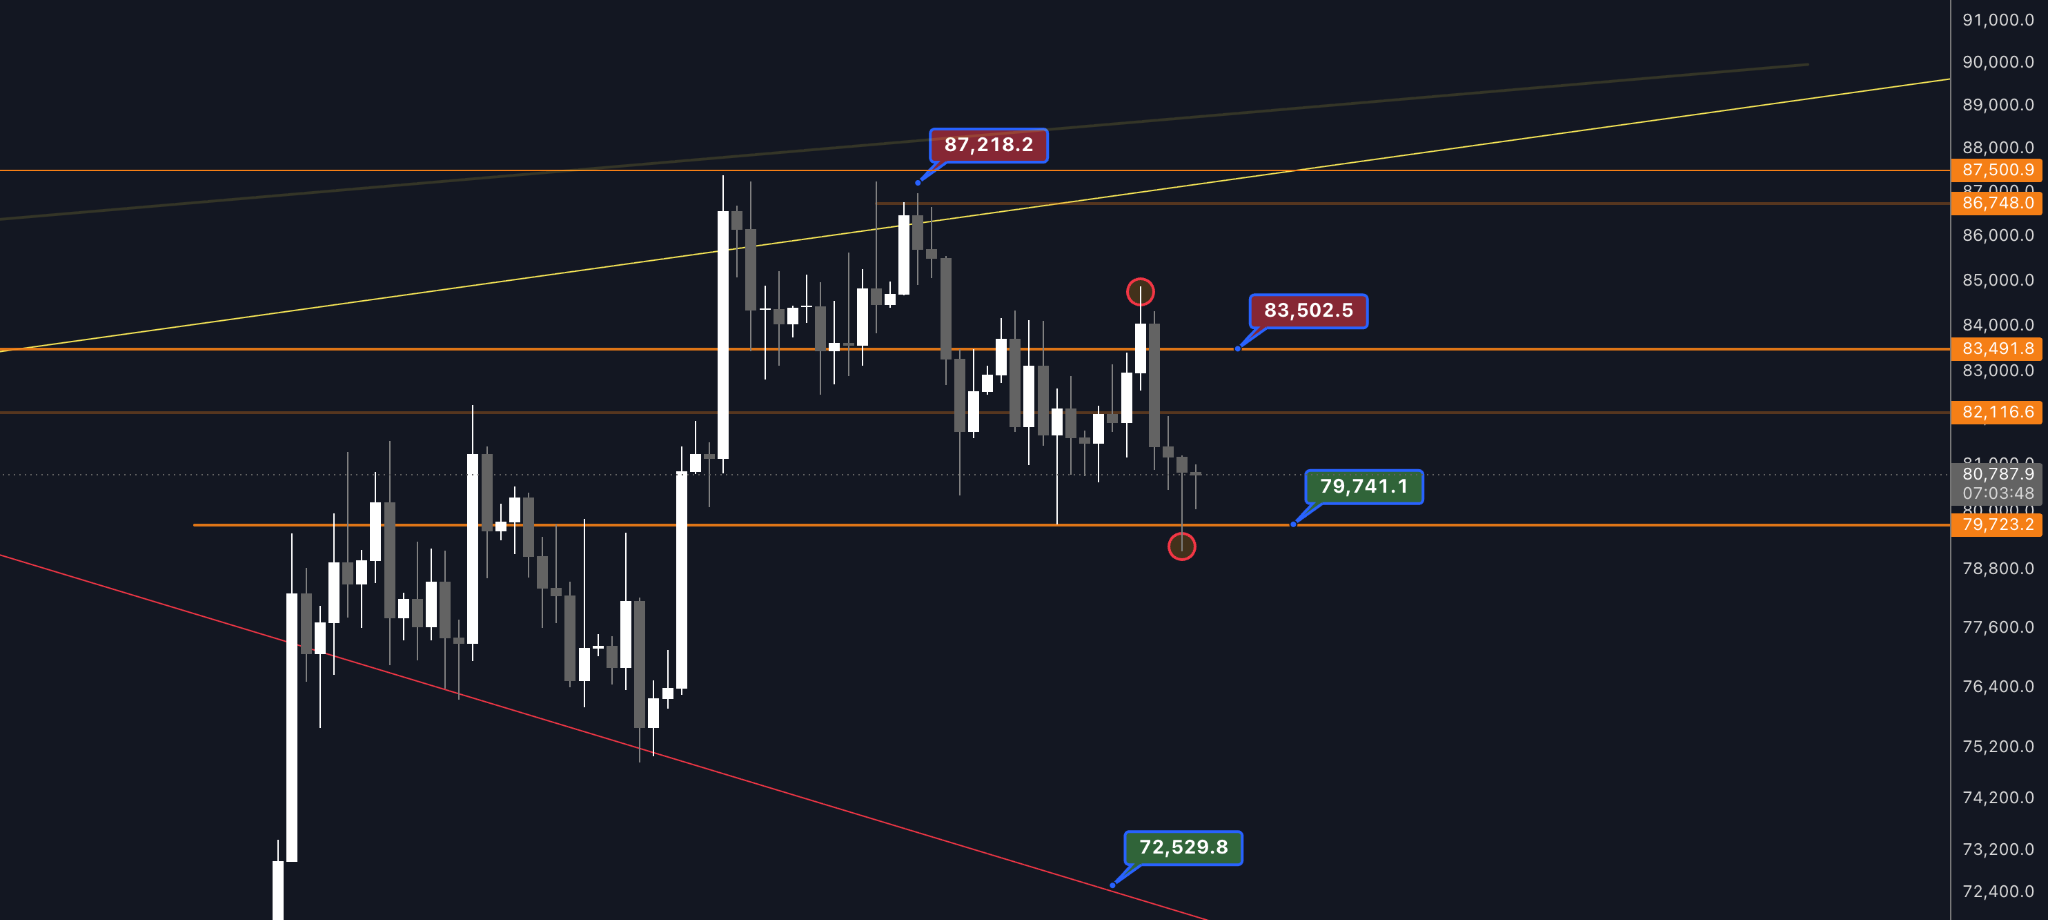
The two levels that continue to define the short-term structure are approximately $79,700 on the downside and $83,500 on the upside.
During the week, Bitcoin attempted to push beyond the upper boundary, briefly trading above 83,500-84,000. Buyers, however, were unable to sustain the move.
Price was rejected and returned inside the range. The market then tested the opposite scenario. Bitcoin moved back toward $79,700 and briefly wicked below the support area, but sellers were unable to establish acceptance below it. The downside attempt was rejected as well, bringing price back into the same structure.
In other words, we have now seen attempts in both directions and both have failed.
That tells us something important.
There currently appears to be neither enough buying pressure to establish a breakout above resistance nor enough selling pressure to produce a sustained breakdown below support.
Until one of those conditions changes, the range remains the dominant structure.
Periods like this can be frustrating because price moves enough to create the impression that something is happening, without actually changing the underlying structure.
A wick above resistance is not necessarily a breakout.
A wick below support is not necessarily a breakdown.
What matters now is whether Bitcoin can move beyond one of these boundaries and remain there.
A sustained reclaim of $83,500 would strengthen the short-term structure and bring the higher resistance region around 86,700-87,500 back into focus.
On the other hand, a confirmed loss of $79,700 would weaken the current structure and shift attention toward lower support.
Until then, movements occurring inside the range should be viewed in the context of consolidation rather than as confirmation of a new directional trend.
Sometimes the most important signal is that there isn't one yet.
The lack of direction in Bitcoin is also reflected in broader crypto market sentiment.
The Fear & Greed Index currently sits at 54, placing the market in Neutral territory.
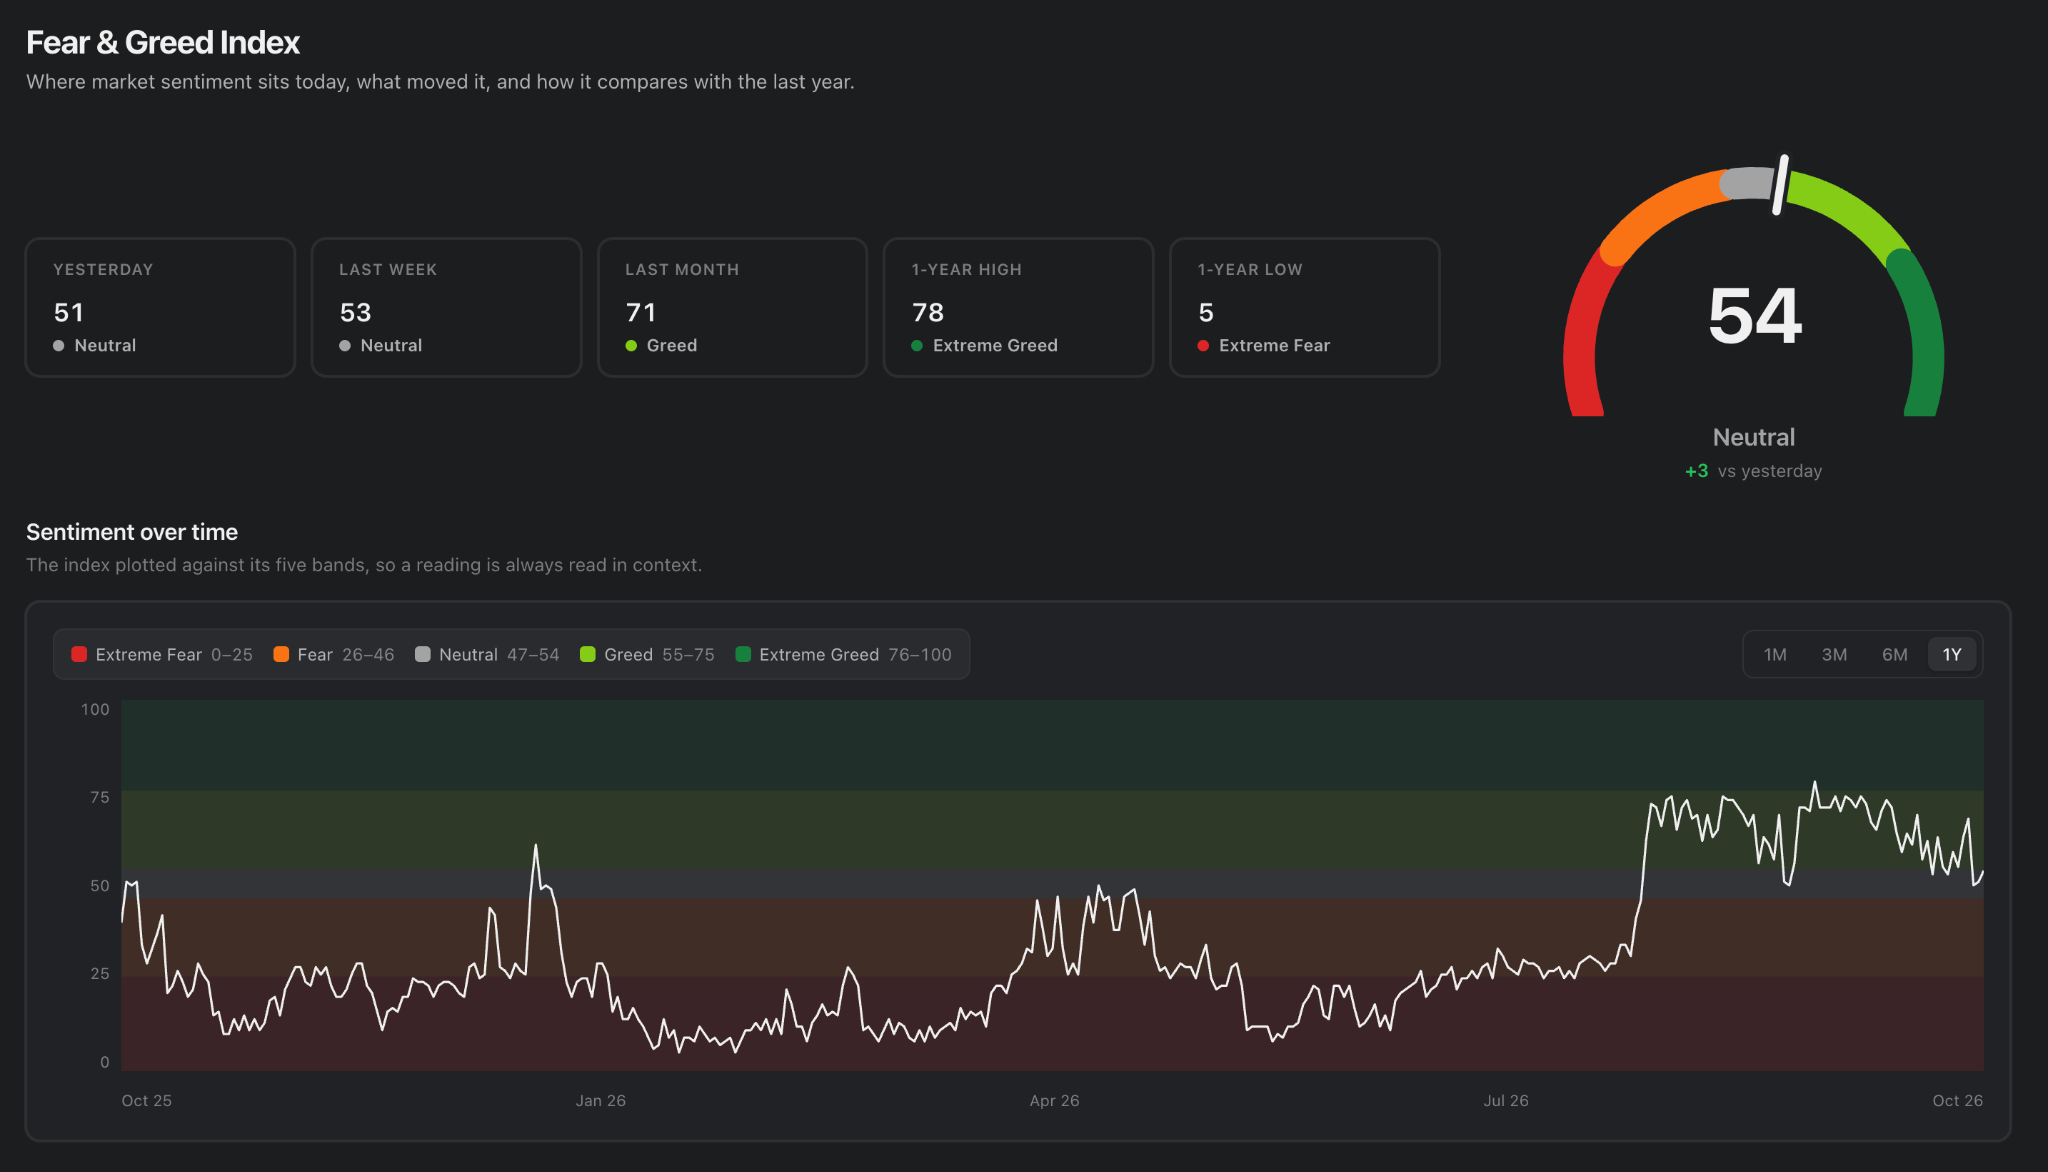
That compares with 53 one week ago and 51 yesterday, suggesting that sentiment has remained relatively stable despite the volatility seen in price.
The more notable change becomes visible when we zoom out.
One month ago, the index stood at 71 Greed. Sentiment has therefore cooled considerably, but importantly, it has not deteriorated into Fear.
That fits closely with what Bitcoin's price structure is showing.
Buyers are not displaying enough conviction to force a breakout, while sellers have so far been unable to generate enough pressure to break the range.
For now, both price structure and sentiment point toward a market waiting for clearer direction.
While Bitcoin remains caught in consolidation, Ethereum is approaching a potentially more consequential technical level.
ETH has continued to lose momentum following its rejection from the $2,778 region. A subsequent recovery attempt around $2,539 also failed to generate sustained upside, and price has since moved below the horizontal level around $2,388.
Attention now turns toward approximately $2,350.
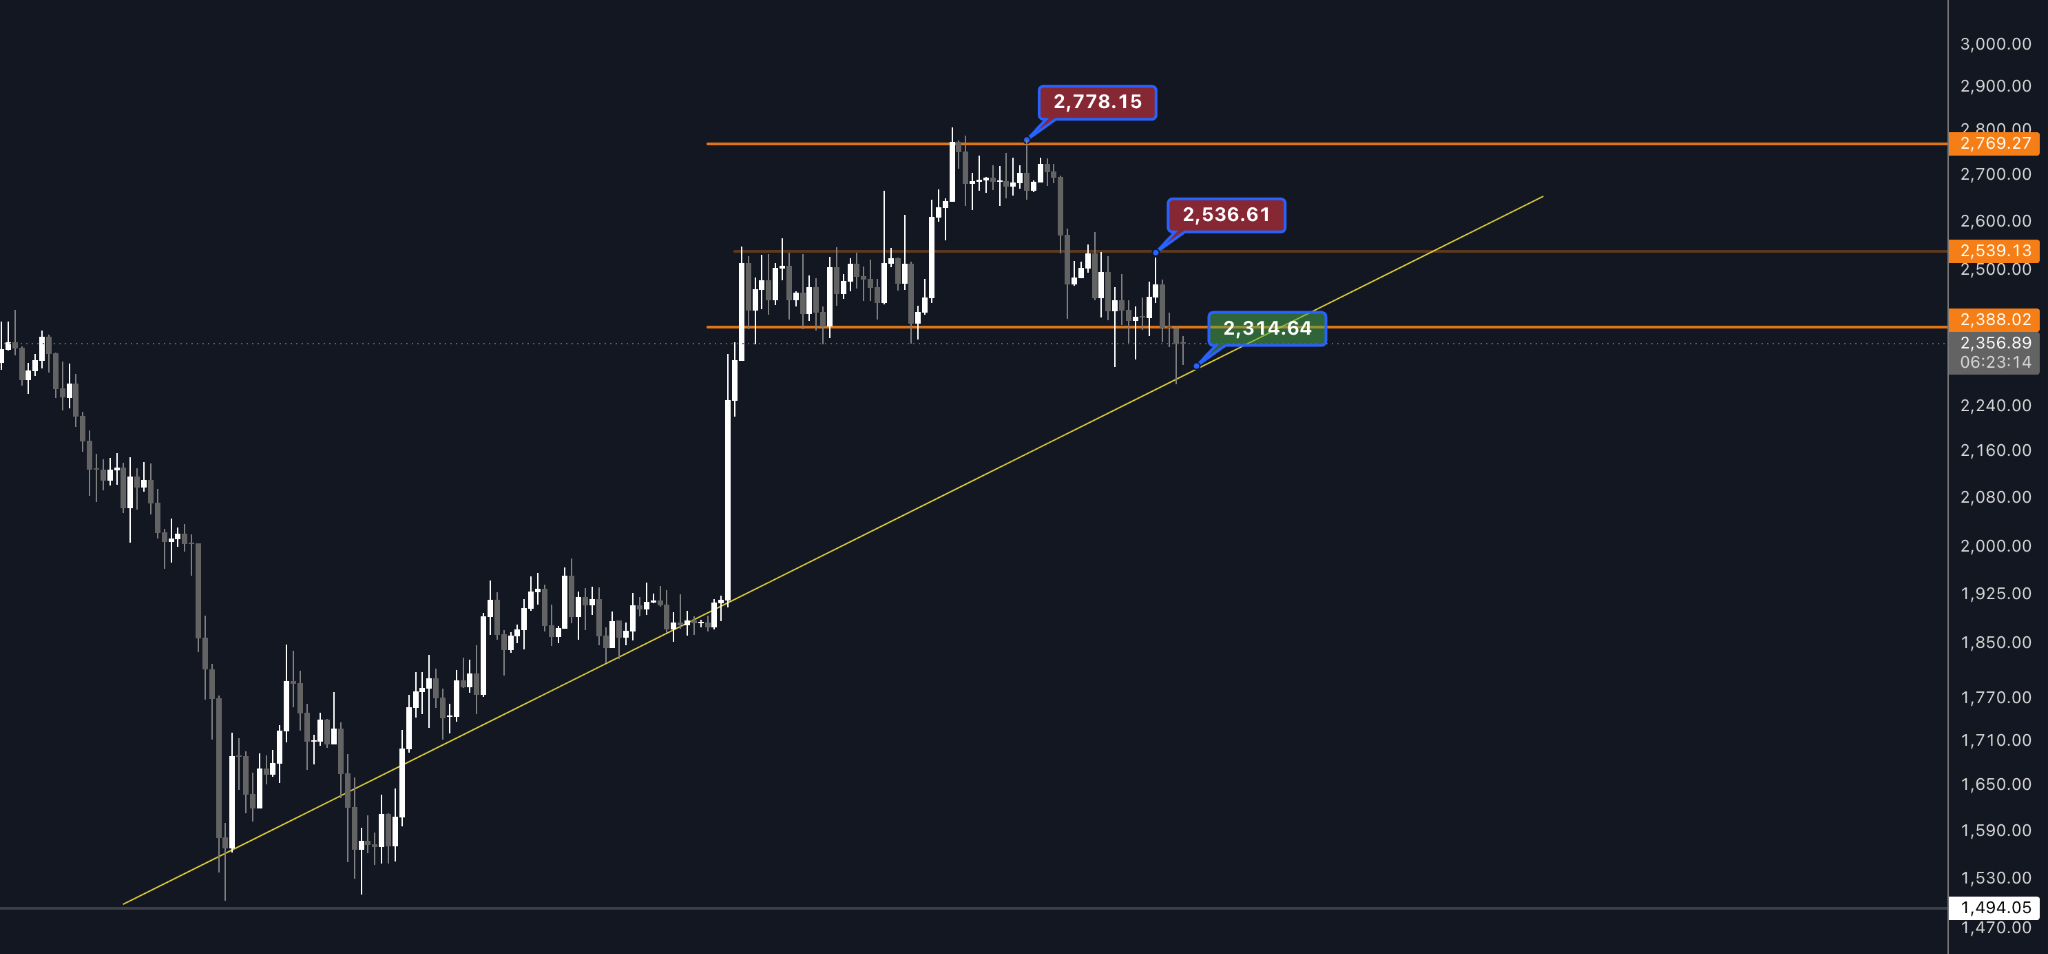
This level matters for more than just the immediate price action.
Around the same area sits the rising trendline that can be traced back to Ethereum's lows in May. That trend has supported ETH's broader recovery over the past several months and has helped maintain the sequence of higher lows.
Ethereum is now approaching that trendline once again.
As long as this structure holds, the broader recovery remains intact despite the recent weakness.
A convincing loss of the $2,314 region and the rising trendline, however, would be more significant than simply losing another horizontal support level. It would challenge the uptrend that has underpinned Ethereum's recovery since May.
For ETH, the coming reaction is therefore particularly important.
The question isn't simply whether $2,314 can produce a short-term bounce.
It's whether Ethereum's broader uptrend can survive another test.
Last week, we asked whether Bitcoin's support was becoming a base or simply a pause before another leg lower.
This week gave us attempts at both outcomes but confirmation of neither.
Bitcoin tested resistance and failed to break out. It tested support and failed to break down. Sentiment remains neutral, and price has returned to the same range that has defined the market over the past week.
There is no reason to force a directional conclusion before the structure provides one.
For Bitcoin, 79,700-73,500 remains the range to watch.
For Ethereum, attention shifts toward the rising trendline around $2,314, where the recovery structure dating back to May is approaching another important test.
Until Bitcoin establishes acceptance outside its range, patience remains part of the analysis.
The question for the coming week is simple: which side can finally take control?

Venkat Hrushikesa Varri has followed the crypto and financial markets for several years, with a particular interest in technical analysis and market development. He is part of the Kaupr team, covering Norwegian and international crypto conferences and contributing live coverage and content from the industry. His interest in market analysis has also grown into a separate project: an analysis platform for the crypto market, now approaching launch, which aims to make market analysis and data-driven insights more accessible to crypto investors. Through Trendline, Venkat shares his own observations and analyses of the market, focusing on trends, market structure and the technical levels that may matter going forward.
Trendline is Kaupr's weekly technical analysis of Bitcoin and the crypto market, published every Monday. Each edition follows the market structure from week to week: which levels matter now, what has changed since the last edition, and what would need to happen for the broader picture to change.
Trendline is analysis, not investment advice, and is not a recommendation to buy or sell any asset. The views are the author's own.