


Bitcoin has finally broken below the range that defined its price action over the past several weeks. After repeated attempts to hold support around $79,700, sellers eventually pushed price lower, shifting attention toward the $76,200 region. Meanwhile, Ethereum has broken below the rising trendline that supported its recovery since May, putting its broader structure under pressure.
Last week, the key question was which side would finally take control of Bitcoin's range. Buyers had failed to establish a breakout above resistance, while sellers had repeatedly struggled to produce a sustained breakdown below support. One week later, we have an answer. Bitcoin has broken below the lower boundary of the range, and the market is now attempting to establish support at a lower level. The important question is no longer whether the previous range will hold, but whether buyers can prevent the latest breakdown from developing into another leg lower.
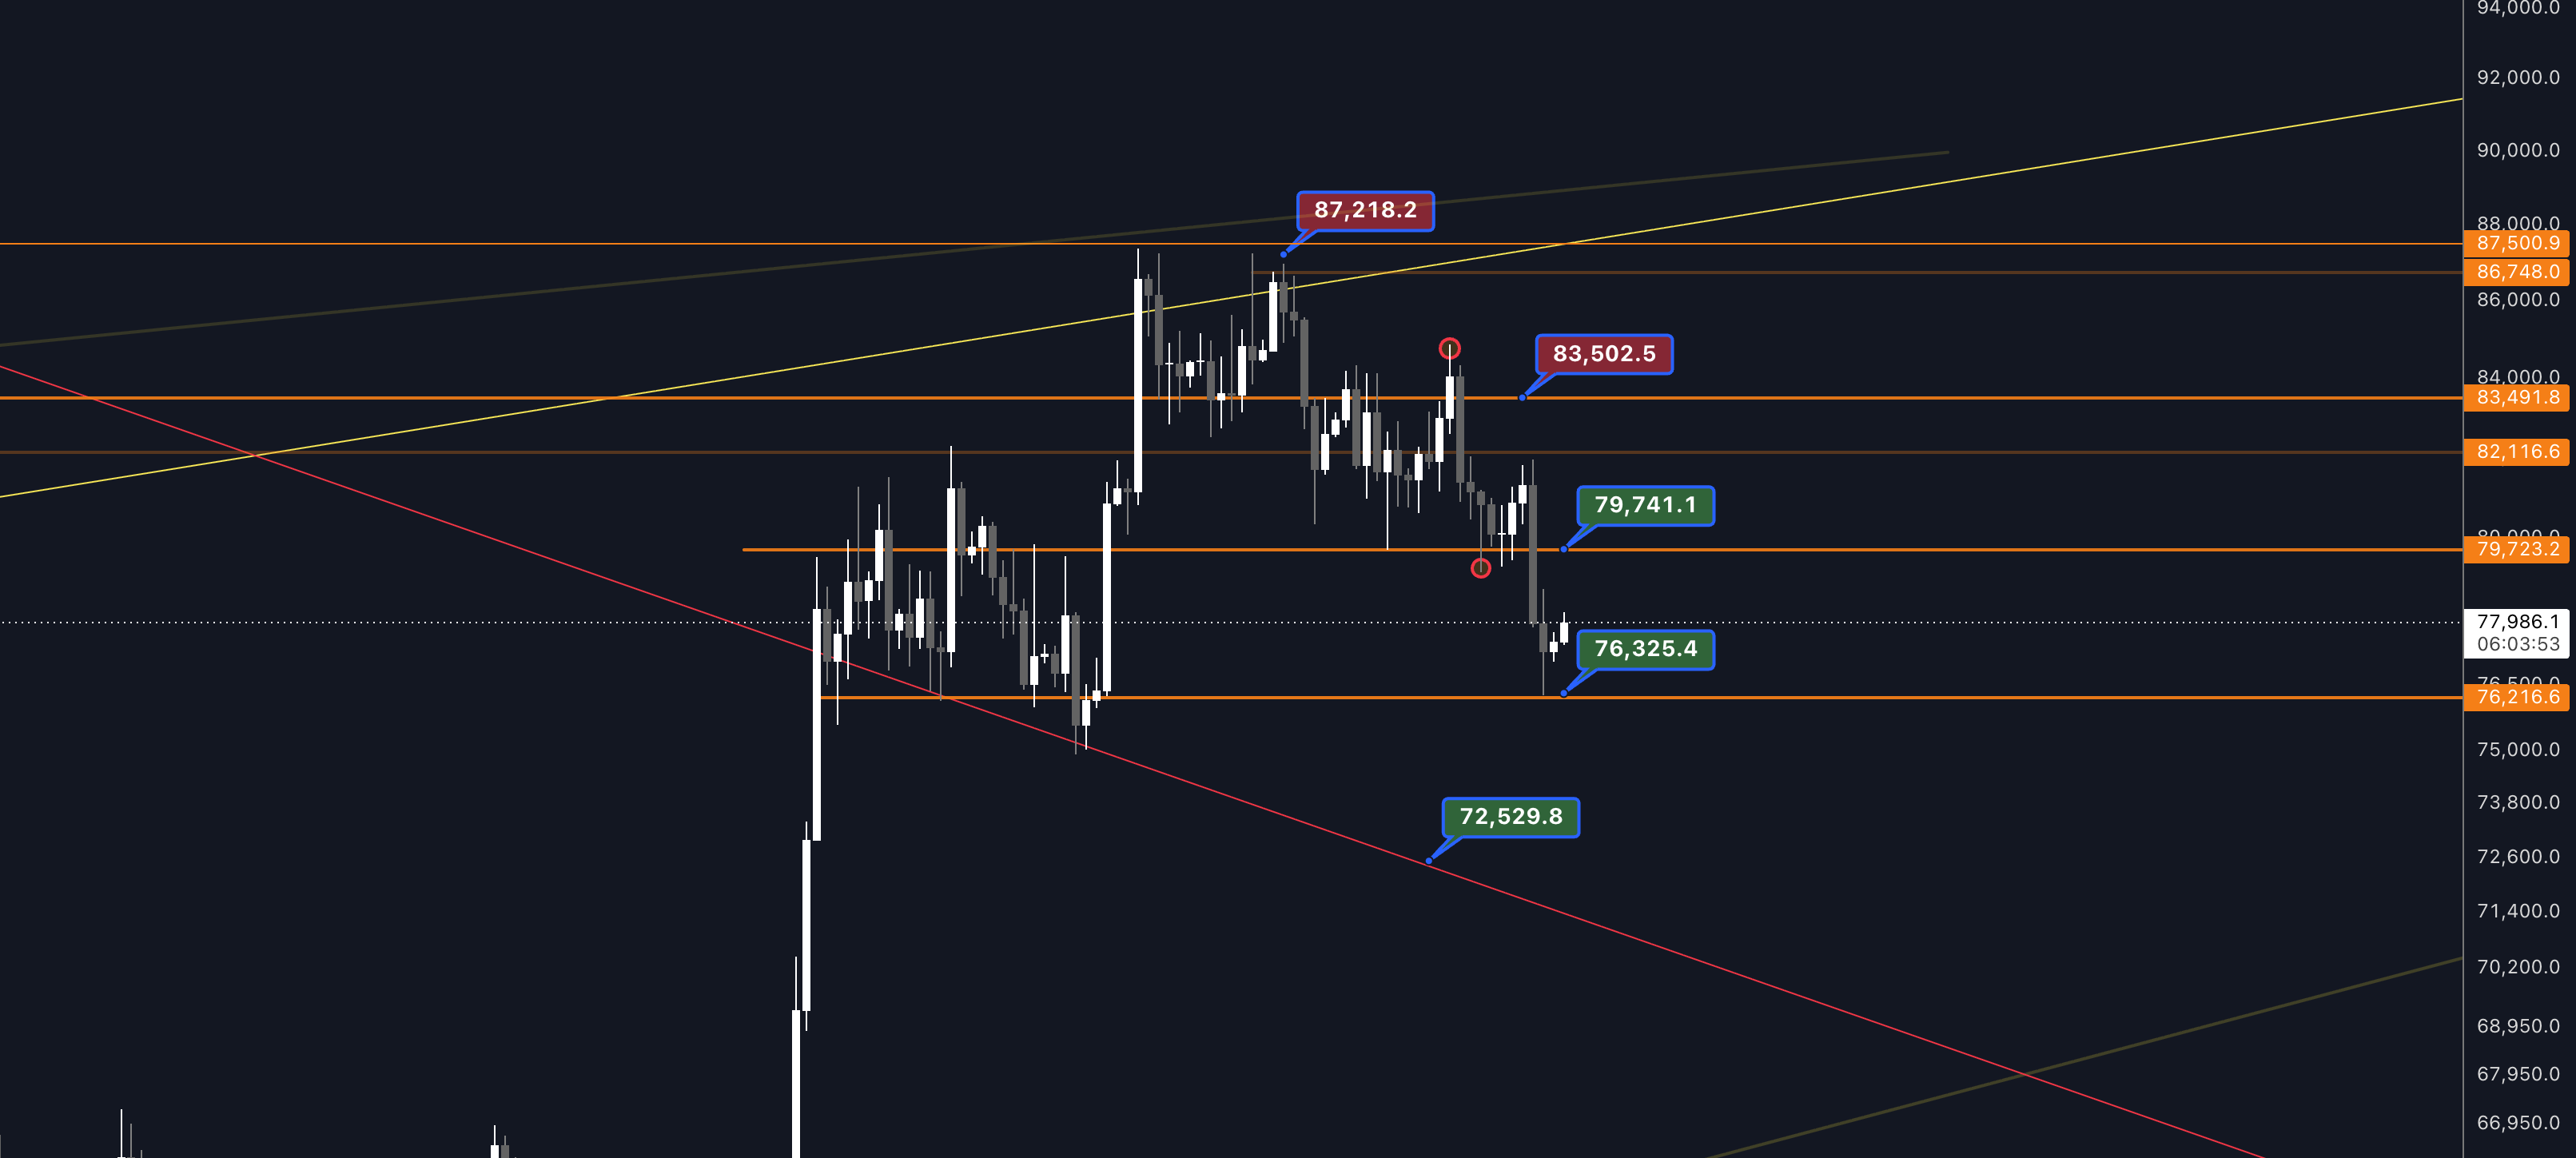
The two levels that defined Bitcoin's short-term structure were approximately $79,700 on the downside and $83,500 on the upside. After failing to sustain its recovery toward $87,200 in October, Bitcoin gradually lost momentum. Each attempt to move higher became less convincing, with price eventually returning toward the lower boundary of the range.
This time, the reaction was different. Bitcoin broke below $79,700 and moved sharply lower, reaching approximately $76,200 before buyers stepped in. Price has since recovered toward $78,000, but the previous support level has not yet been reclaimed. That distinction matters because a level that previously acted as support can become resistance once it has been broken. In Bitcoin's case, the $79,700 region is now the first important obstacle for any recovery attempt.
The market has therefore moved from consolidation into a weaker short-term structure. Rather than trading between two established boundaries, Bitcoin is now attempting to find a new area where buyers are willing to step in.
Binance Hit by $6.3 Billion Security Breach
Adding to the uncertainty, Binance suffered a major security breach involving approximately $6.3 billion in digital assets transferred from its hot wallets. The incident raised renewed concerns around centralized exchange security and added pressure to an already fragile market. Binance has stated that customer losses will be covered and reported on November 1 that approximately 95% of the affected assets had been recovered or covered.
Although Bitcoin's weakness was already visible before the incident, the timing added another layer of uncertainty. With price already struggling to hold key support, the breach further challenged market confidence at an important moment.
Following the breakdown, attention shifts toward approximately $76,200. This is where Bitcoin found buyers during the latest sell-off, with price briefly testing the region before recovering. The initial reaction is encouraging, but one bounce is not enough to establish a sustainable base.
For the bullish scenario to improve, Bitcoin first needs to reclaim $79,700. A sustained move above this level would suggest that buyers are beginning to recover some of the ground lost during the breakdown. Beyond that, the next resistance levels sit around $82,100 and $83,500. Reclaiming these areas would represent a more meaningful improvement in the short-term structure and bring the previous consolidation range back into focus.
On the downside, a confirmed loss of $76,200 would weaken the picture further. Below this region, attention shifts toward the descending trendline currently intersecting around $72,500. This provides another important technical area to monitor if selling pressure continues. For now, the immediate question is whether $76,200 can develop into a base or whether it will simply provide temporary relief before another move lower.
While Bitcoin has broken below its horizontal support, Ethereum is facing a different but equally important technical development. ETH has now moved below the rising trendline that has supported its recovery since May. This trendline has been particularly important throughout the past several months, providing dynamic support during previous pullbacks and helping maintain the broader sequence of higher lows that underpinned Ethereum's recovery.
That structure is now broken. Ethereum's weakness has been developing for several weeks. Following its rejection around $2,778, price struggled to regain momentum. A subsequent recovery attempt toward $2,539 also failed to produce sustained upside, and ETH eventually moved below the horizontal support around $2,388. The breakdown below the rising trendline adds another layer of concern.
Attention now turns toward approximately 2,175–2,200, where Ethereum recently found buyers following the sell-off. As long as this region holds, there remains room for a recovery attempt. However, the first important level to reclaim is around $2,334, which coincides with the broken rising trendline. A recovery above this area would be an encouraging first signal. Beyond that, $2,388 represents the next major resistance, followed by approximately $2,539.
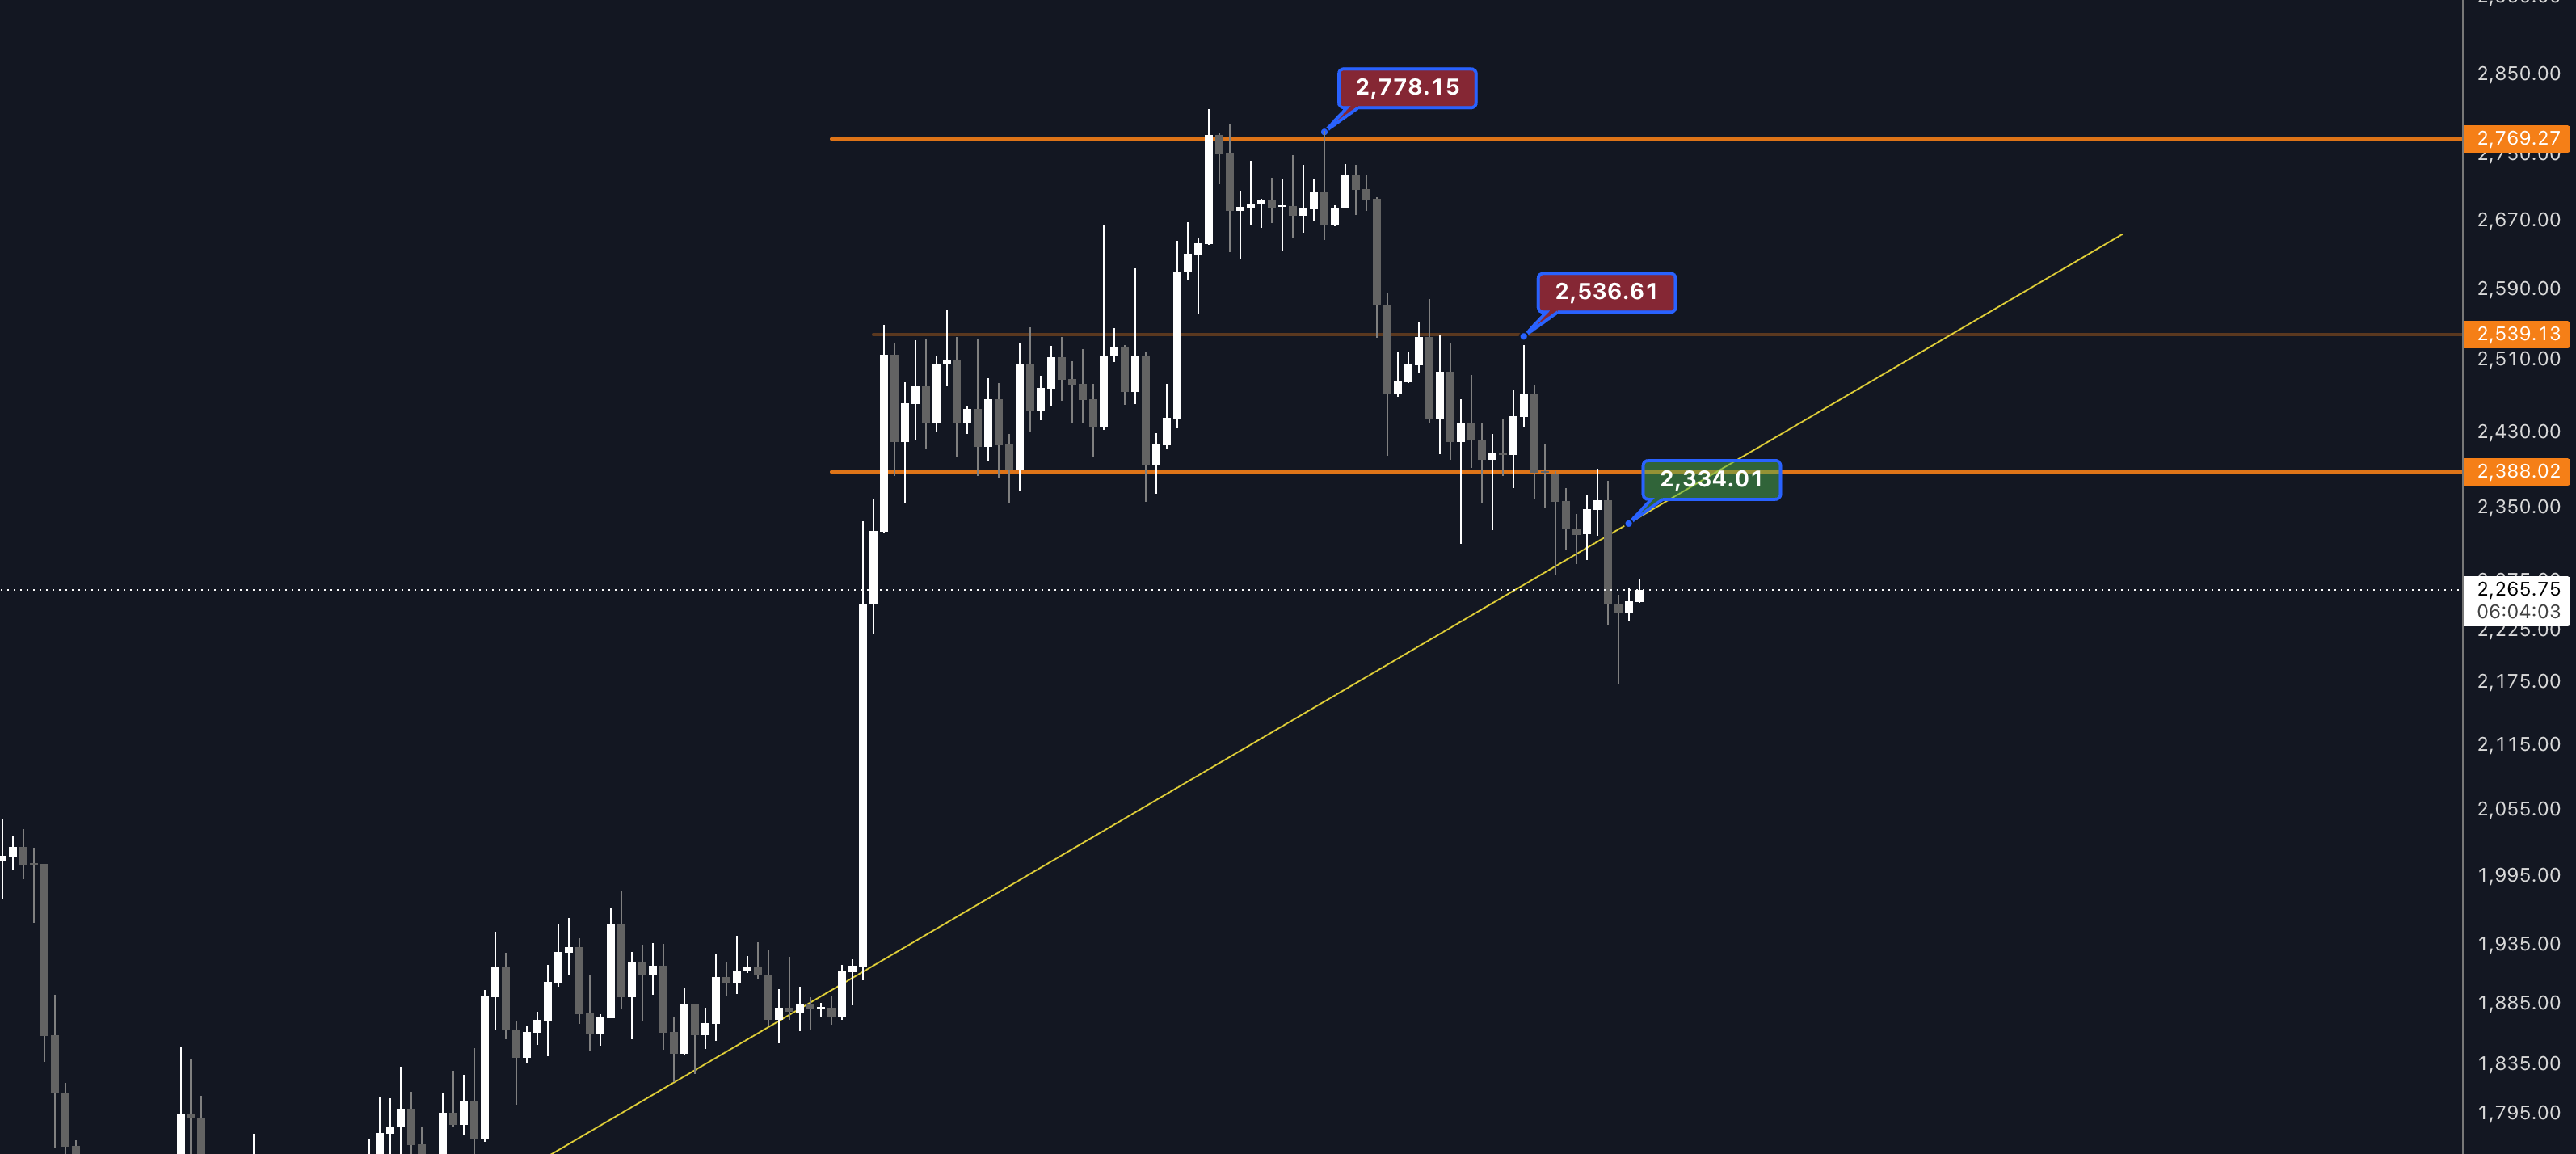
Until Ethereum can reclaim these levels, the previous recovery structure remains under pressure. The important distinction is that losing a horizontal support level and losing a multi-month rising trendline are not necessarily the same thing. The latter challenges the broader structure that has supported the recovery since May. For Ethereum, the coming reaction will therefore be particularly important.
The technical picture across the two largest cryptocurrencies has changed considerably over the past week. Bitcoin has lost the range that contained price action throughout much of October, while Ethereum has broken below the rising trendline that supported its recovery for several months. Both assets are now attempting to stabilize, but neither has provided convincing confirmation that the latest weakness has run its course.
This does not automatically mean that another significant decline is imminent. Markets can recover quickly after sharp sell-offs, particularly when buyers begin defending important technical levels. However, the burden of proof has shifted. Buyers now need to demonstrate that they can reclaim previously lost levels rather than simply defend the next available support.
For Bitcoin, the immediate focus is on $76,200. Holding this region could provide the foundation for a recovery toward $79,700, while a confirmed breakdown would bring the descending trendline around $72,500 into focus. For Ethereum, attention turns toward 2,175–2,200 on the downside and $2,334 on the upside. Reclaiming the broken trendline would be an important first step toward repairing the technical structure.
Last week, we asked which side would finally take control of Bitcoin's range. This week, sellers have delivered the breakdown they had previously struggled to achieve. The market is now facing a different question: can buyers establish a new base around current levels, or has the loss of support opened the door to another leg lower?
For now, $76,200 in Bitcoin and the broken trendline around $2,334 in Ethereum are the levels I will be watching most closely. The next reaction could tell us a great deal about where the market is heading in November.

Venkat Hrushikesa Varri has followed the crypto and financial markets for several years, with a particular interest in technical analysis and market development. He is part of the Kaupr team, covering Norwegian and international crypto conferences and contributing live coverage and content from the industry. His interest in market analysis has also grown into a separate project: an analysis platform for the crypto market, now approaching launch, which aims to make market analysis and data-driven insights more accessible to crypto investors. Through Trendline, Venkat shares his own observations and analyses of the market, focusing on trends, market structure and the technical levels that may matter going forward.
Trendline is Kaupr's weekly technical analysis of Bitcoin and the crypto market, published every Monday. Each edition follows the market structure from week to week: which levels matter now, what has changed since the last edition, and what would need to happen for the broader picture to change.
Trendline is analysis, not investment advice, and is not a recommendation to buy or sell any asset. The views are the author's own.