


The cryptocurrency market has experienced another significant wave of selling pressure, with both Bitcoin and Ethereum extending their declines after breaking below several important technical support levels. Bitcoin has fallen below the $72,600 region and is now trading around $65,000, while Ethereum has experienced an even sharper decline, falling approximately 26% from the $2,330 support breakdown when measured to its latest downside wick near $1,705. Both assets have now moved considerably below the levels that previously supported their price structures, raising further questions about whether buyers can establish a new foundation.
Last week, the focus was on whether Bitcoin could defend the $74,500 region and whether Ethereum could find support around $2,180 following its breakdown below $2,330. We also highlighted the importance of the longer-term trendlines supporting both assets. One week later, both situations have deteriorated further. Bitcoin has broken below the $72,600 support, while Ethereum has moved significantly lower after losing the $2,350 region and breaking below its broader ascending structure.
The latest price action suggests that the market has entered a considerably weaker technical phase, with previous support levels now representing potential resistance areas.
Bitcoin's technical structure has weakened considerably over the past week. After failing to recover above the $74,500 region, sellers regained control and pushed price below the next important support area around $72,600.
The breakdown is particularly significant because $72,600 represented an important technical confluence. The horizontal support level aligned closely with the longer-term descending trendline that had provided an important reference point throughout the previous correction.
Once Bitcoin moved below this region, selling pressure accelerated. Price subsequently moved through the $70,000 area and continued lower, eventually approaching approximately $62,000 before experiencing a short-lived recovery.
This development represents a meaningful change in the broader technical picture. The longer-term ascending trendline that had supported Bitcoin's price structure since the summer has also been broken, leaving the market considerably weaker than it was during the previous analysis.
Looking at the broader chart, Bitcoin had previously been trading within a descending channel after reaching highs around the $87,000 region. Successive lower highs illustrated the difficulty buyers faced in regaining control, while repeated failures to reclaim resistance levels gradually weakened the market structure.
However, there is another important element to the current price action.
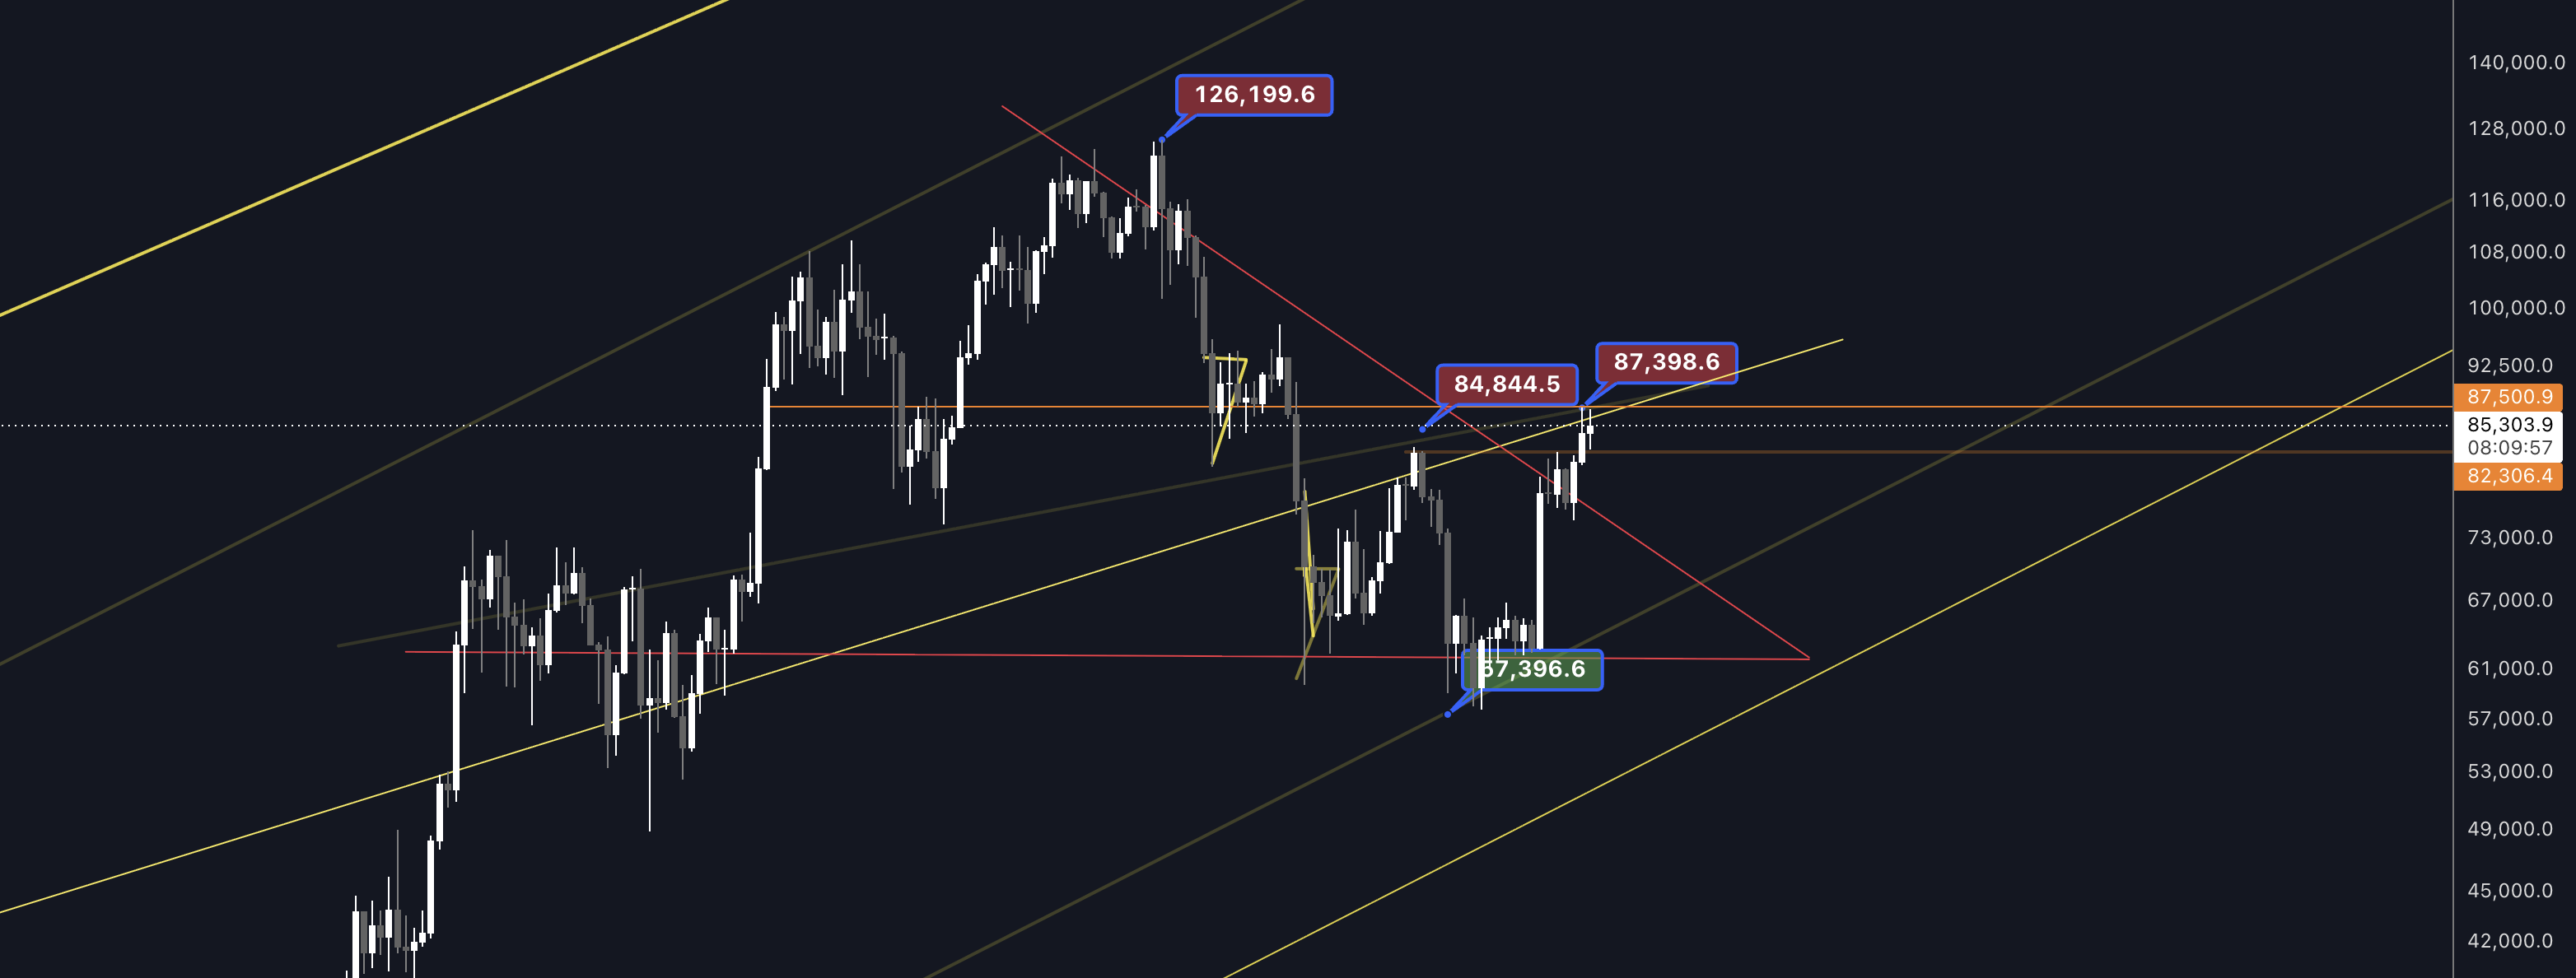
Bitcoin has now re-entered the larger triangle formation that we first highlighted in Trendline #1, following a rejection at the $87,000 level, which we previously identified as a key level to watch. Since reaching approximately $87,500, Bitcoin has recorded six consecutive weekly red candles.
This development is particularly significant as the ongoing decline brings Bitcoin back into a broader technical structure that has been a key part of our market analysis since the very beginning of this series.
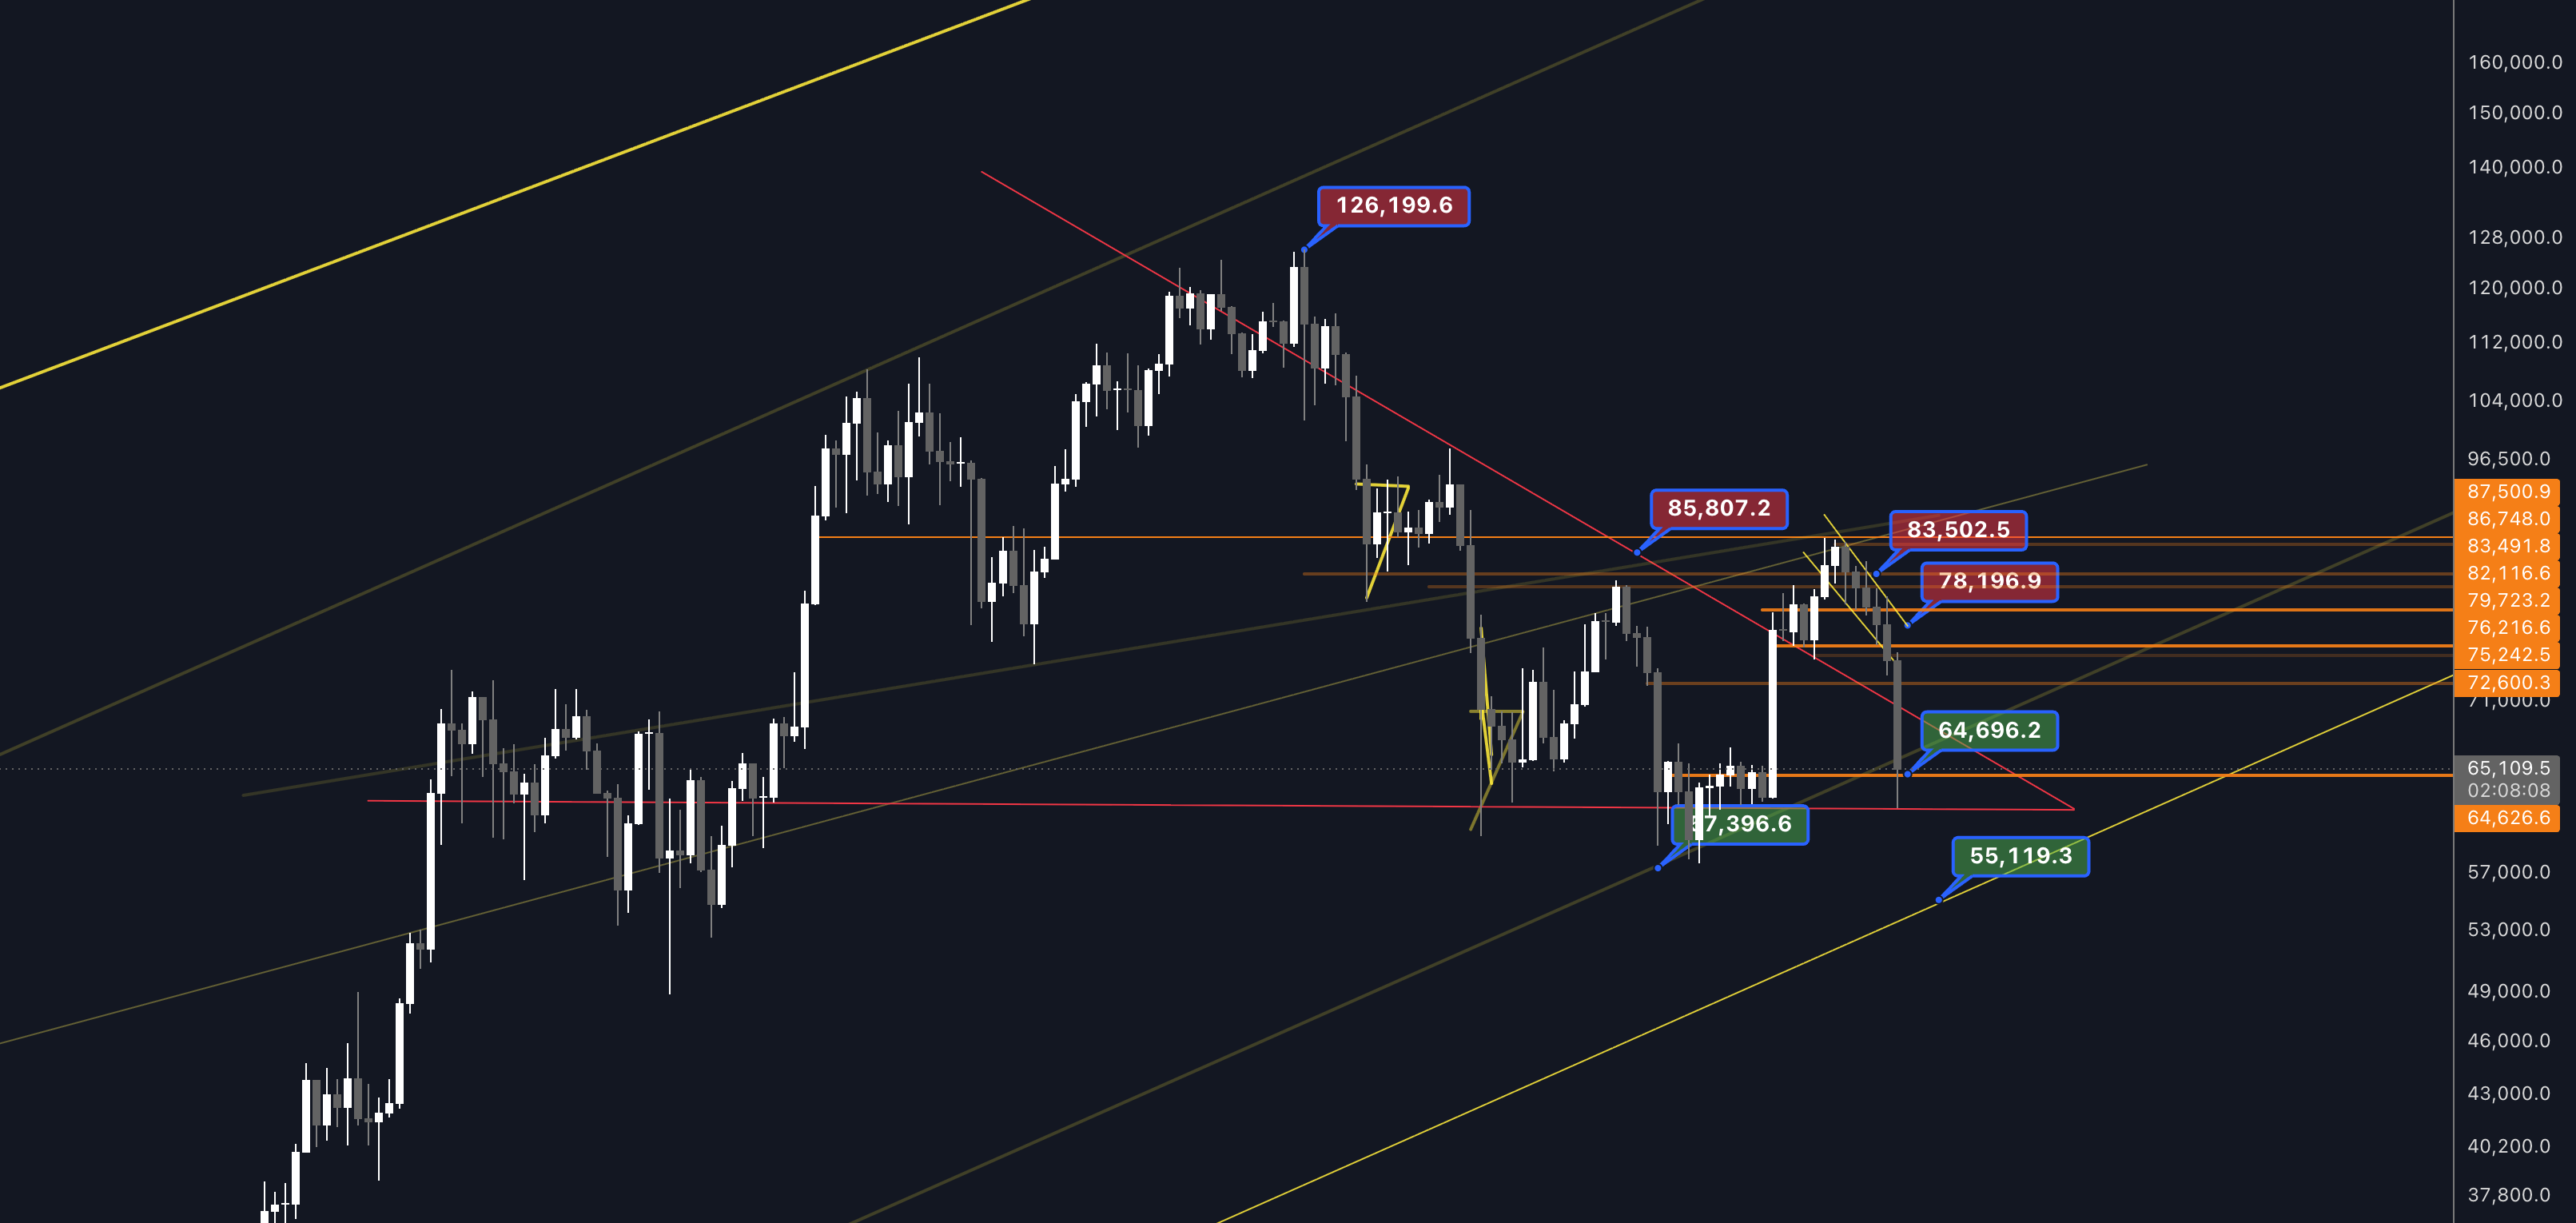
Rather than viewing the latest breakdown as an entirely new market structure, it is important to consider how price is interacting with the larger formation. Bitcoin remains within this broader technical setup, and the coming reaction around its lower support levels could become particularly important in determining the next direction.
With Bitcoin currently trading around $65,000, attention has shifted toward the $64,600 region.
This level represents an important immediate reference point following the latest sell-off. Price has recovered slightly above this area after experiencing a sharp downward move, suggesting that buyers are attempting to stabilise the market.
However, the recovery remains relatively limited compared with the magnitude of the decline. Until Bitcoin demonstrates a more convincing reaction, it remains difficult to determine whether the latest movement represents the beginning of a recovery or simply a temporary pause following heavy selling pressure.
The recent price action also highlights the volatility surrounding the current market structure. Bitcoin experienced a sharp downward move, briefly reaching approximately $62,000 before recovering toward its current trading range.
If buyers manage to defend the $64,600 region, Bitcoin could attempt to establish a short-term support base and recover toward higher levels.
On the other hand, a sustained move below $64,600 would increase the likelihood of another test of the recent lows around $62,000.
The $62,000 region is now one of the most important levels on Bitcoin's chart.
A breakdown below this area would represent another significant deterioration in the market structure. More importantly, it would shift attention toward a longer-term technical support level that I have been monitoring since February.
During my Kaupr Live appearance on February 27, I discussed Bitcoin's broader descending trend channel and highlighted the importance of its lower boundary. At the time, the technical structure pointed toward a potential support region around $55,500.
That level is particularly relevant now.
With Bitcoin approaching the $62,000 region, the lower boundary of the previously identified trend channel becomes an important reference point if the current support fails. Based on the channel structure, approximately $55,500 represents the next major area where buyers could potentially step in.
The significance of this level is that it was mapped out well before the current decline. It is not a level drawn in response to the latest sell-off, but part of a broader technical framework that has been followed throughout the year.
For now, Bitcoin has not confirmed a breakdown below $62,000. However, if that region fails to hold, the $55,500 area becomes increasingly relevant.
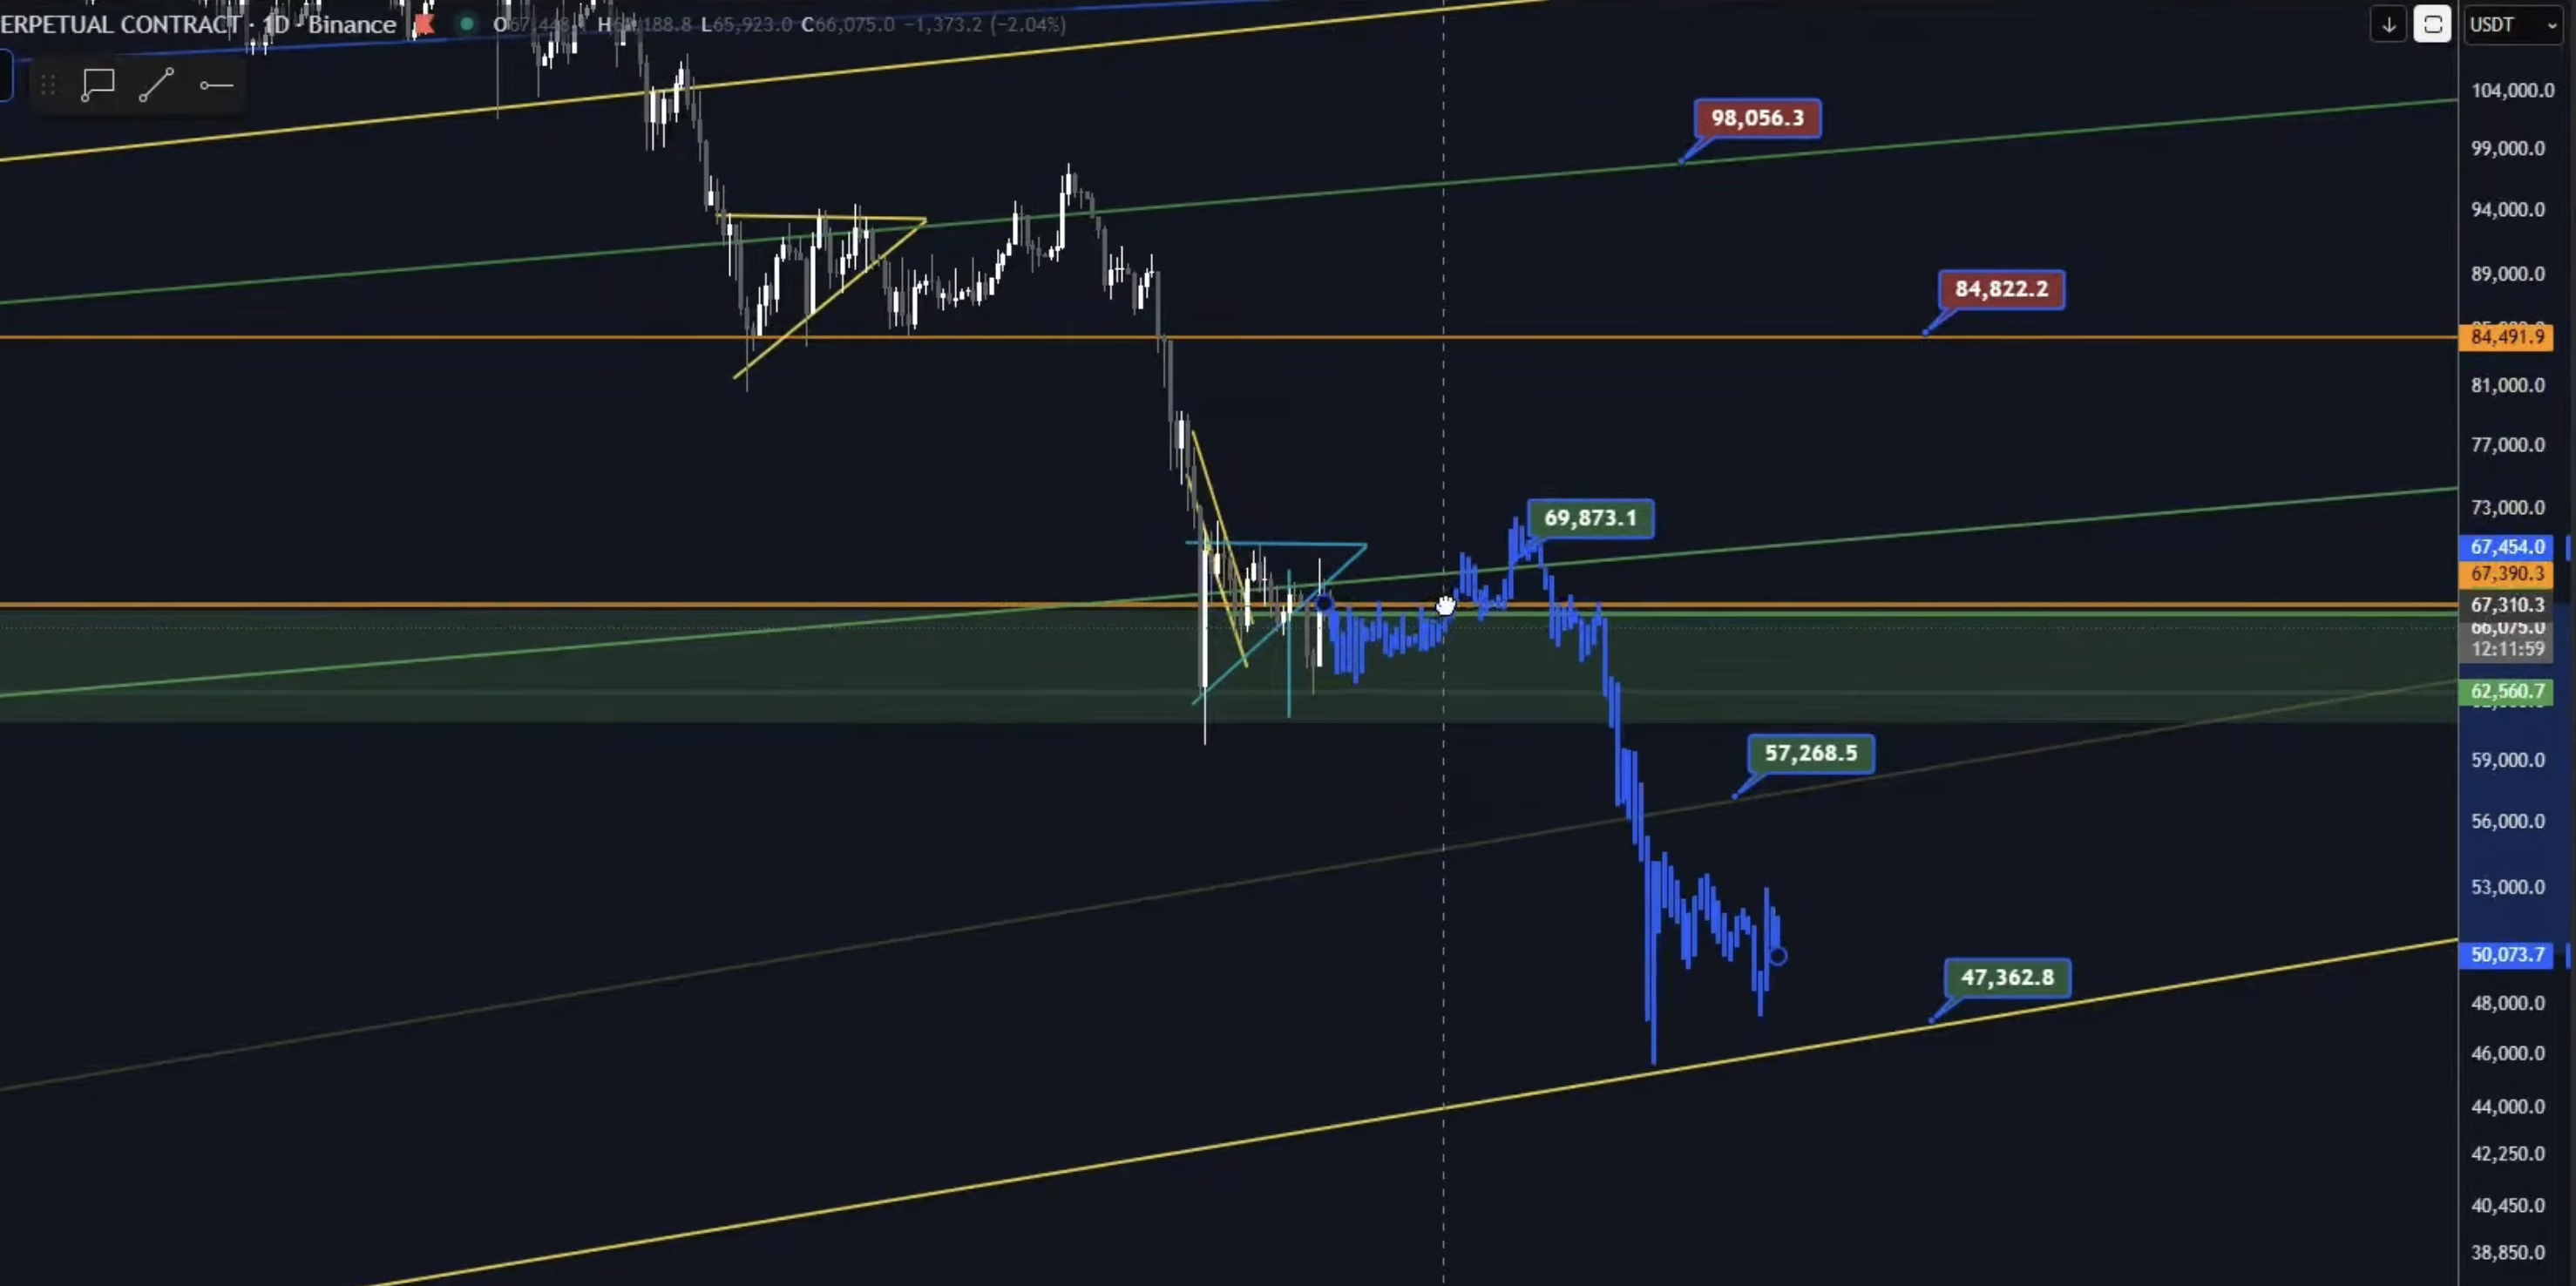
A reaction from the lower boundary could provide an opportunity for Bitcoin to establish another support base. Conversely, a sustained breakdown below the longer-term channel would indicate an even more significant deterioration in the broader technical structure.
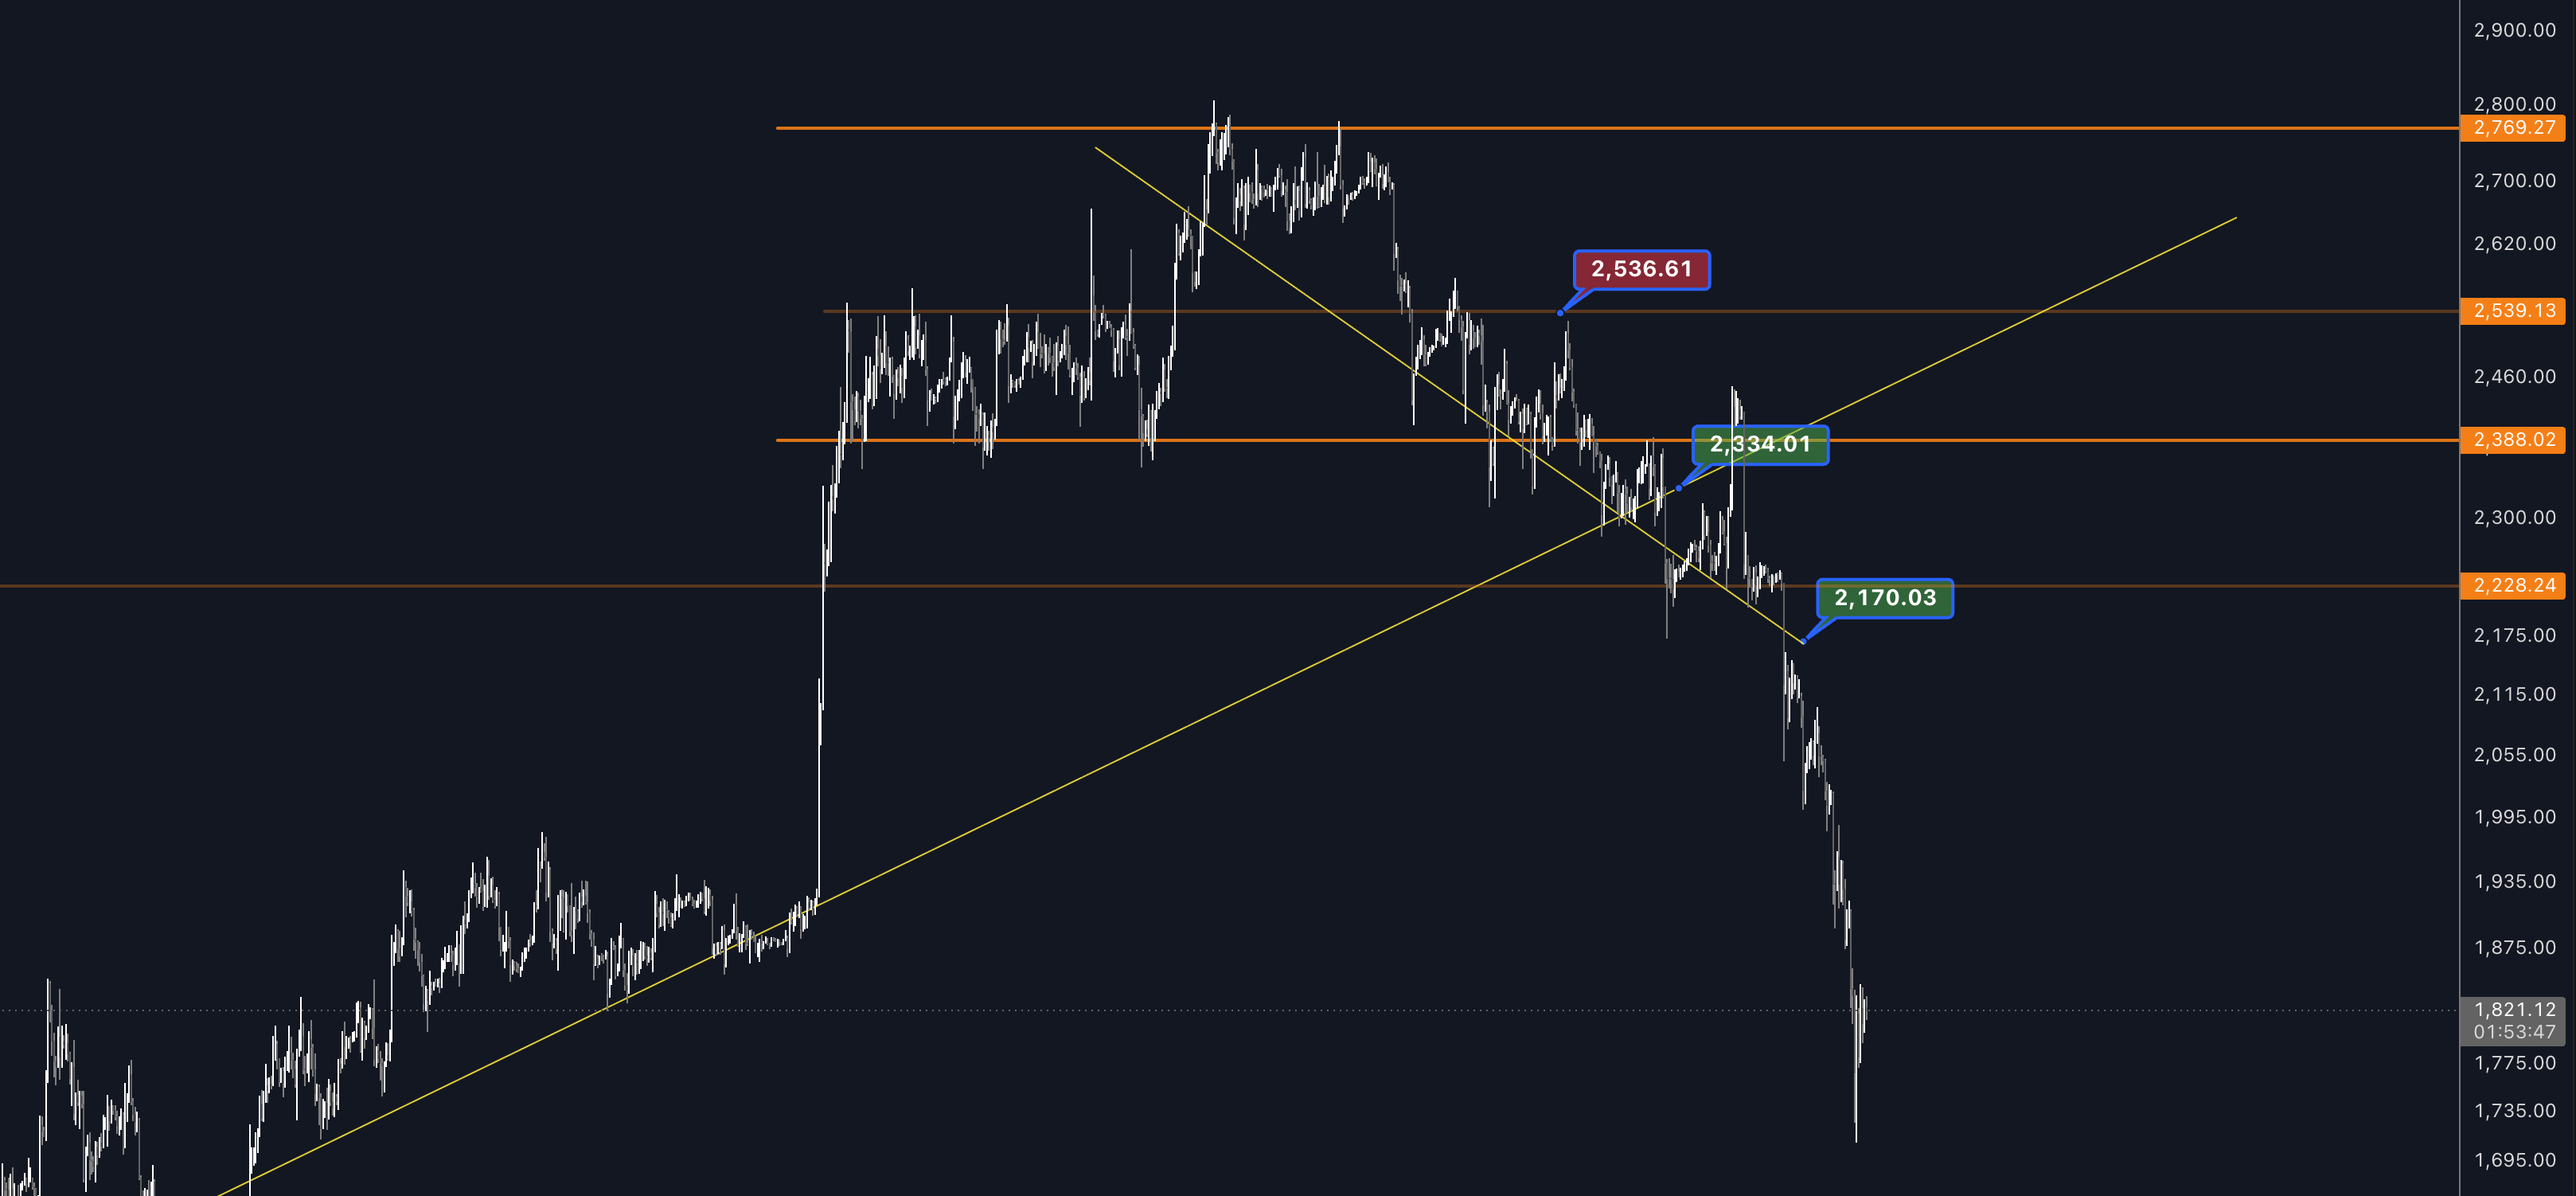
Ethereum's technical picture has deteriorated even more significantly over the past week. In our previous analysis, we highlighted the importance of the $2,330 region, which had acted as an important horizontal support level following the breakdown of the rising trendline that had supported ETH's recovery.
That support has now given way, and the subsequent price action has resulted in a substantial acceleration in selling pressure.
However, the importance of this breakdown goes further back than last week's analysis.
In Trendline #4, published on October 26, I specifically highlighted the approximately $2,314 region as one of the most important long-term support areas on Ethereum's chart. The level coincided with a rising trendline that could be traced back to Ethereum's lows in May.
At the time, Ethereum was approaching this trendline once again, and the analysis focused on whether the broader recovery structure could survive another test.
The distinction was important: losing the $2,314 region together with the rising trendline would represent considerably more than simply losing another horizontal support level. It would challenge the broader uptrend that had supported Ethereum's recovery since May.
Since then, Ethereum has failed to maintain that broader structure.
Following the initial breakdown below the $2,330 region, ETH struggled to recover its previous support levels. The market initially attempted to stabilise around the $2,228 region, while the descending trendline continued to provide resistance during recovery attempts.
However, buyers eventually failed to defend this area as well.
The next important reference was approximately $2,170, where the descending trendline and previous price structure provided another potential area for support. Ethereum subsequently moved below this region, triggering another significant wave of selling.
Since breaking below the $2,330 support, Ethereum has experienced a decline of approximately 26% when measured to the latest downside wick, which reached roughly $1,705.
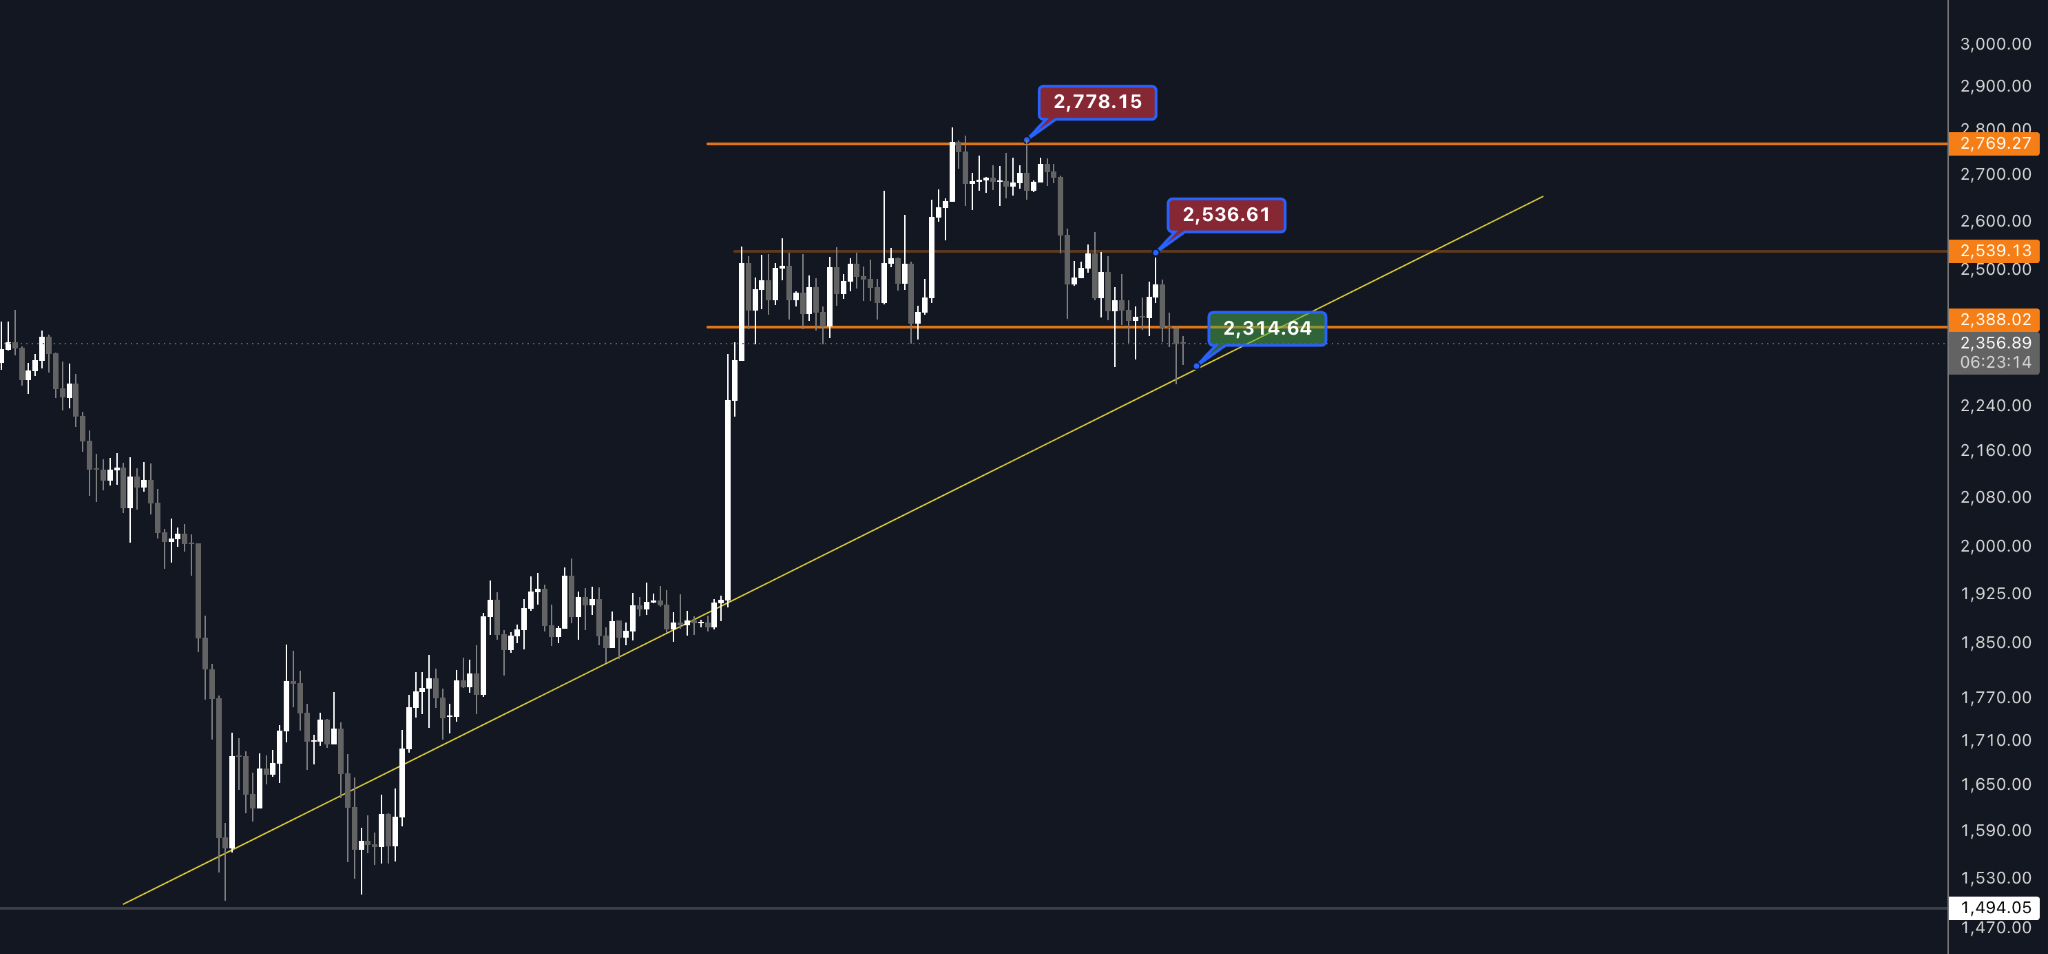
The latest price action has been particularly aggressive, with ETH falling from above $2,300 toward the $1,700 region in a relatively short period.
Although price has recovered slightly and is currently trading around $1,824, the magnitude of the decline illustrates how significantly Ethereum's technical structure has weakened.
The rising trendline that had supported Ethereum's recovery since the summer has now been broken, while the descending trendline that previously guided the correction has also failed to provide meaningful support.
The importance of the October 26 analysis is now particularly clear. The $2,314 region was identified as a critical level because of its relationship with the broader rising structure. Its eventual breakdown marked a significant deterioration in Ethereum's technical position.
Until Ethereum can establish a new support base and recover some of its previously lost levels, the broader downward structure remains intact.
With Ethereum currently trading around $1,824, attention turns toward the recent low near $1,705.
This region represents the most important immediate downside reference following the latest sell-off. The sharp reaction from this area suggests that buyers have started to step in after the substantial decline.
If Ethereum manages to defend the recent low, price could attempt to consolidate and recover toward higher levels.
However, the recovery needs to be viewed in the context of the broader market structure. A short-term rebound following a decline of this magnitude does not necessarily indicate that the downward trend has ended.
A sustained breakdown below approximately $1,700 would further weaken Ethereum's technical position and suggest that the latest selling pressure has not yet reached a convincing support area.
For now, the ability to hold above the recent low will be important in determining whether Ethereum can begin establishing a new trading range.
On the upside, Ethereum faces several resistance levels that will determine whether buyers can begin recovering control.
The first important region is approximately $2,170. This level previously represented an important technical area around the descending trendline before the latest breakdown. It now represents the first major resistance that Ethereum needs to reclaim.
Further above, approximately $2,228 represents another important resistance level, followed by $2,388.
The $2,388 region is particularly significant because it previously acted as an important support and resistance area during the earlier consolidation. A sustained recovery above this level would represent a more meaningful improvement in Ethereum's technical structure.
Beyond that, approximately $2,539 remains a major resistance level. This was one of the important levels highlighted in our previous analysis and continues to represent a significant hurdle for any broader recovery attempt.
For Ethereum to demonstrate a convincing improvement, buyers would first need to reclaim $2,170 and $2,228. A move above $2,388 would provide stronger evidence that the latest downward structure is beginning to weaken.
Until then, Ethereum remains vulnerable to further downside.
The technical picture across Bitcoin and Ethereum has weakened considerably over the past week. Bitcoin has broken below $72,600 and extended its decline toward $65,000, while Ethereum has experienced an even sharper move lower after losing the $2,330 support level, with its latest downside wick reaching approximately $1,705.
Both assets have now broken below important technical structures that previously supported their price movements. Previous support levels have shifted into resistance, while the latest recovery attempts remain relatively limited compared with the magnitude of the declines.
What makes the current situation particularly important is the speed at which the market has moved through several established technical levels.
For Bitcoin, $64,600 and $62,000 are the immediate support levels to watch. A breakdown below $62,000 would bring the longer-term $55,500 trend channel support into focus. On the upside, $72,600 is the first major resistance to reclaim, followed by $74,500 and $75,300–76,200.
For Ethereum, $1,705 remains the key support level. Holding it could open a recovery toward $2,170, $2,228 and $2,388. A sustained break below $1,700 would further weaken the outlook.
Both assets have continued lower than anticipated, with Bitcoin losing $72,600 and Ethereum breaking below $2,330.
The key question is whether buyers can establish a sustainable bottom or whether these rebounds are simply temporary pauses in a broader correction.

Venkat Hrushikesa Varri has followed the crypto and financial markets for several years, with a particular interest in technical analysis and market development. He is part of the Kaupr team, covering Norwegian and international crypto conferences and contributing live coverage and content from the industry. His interest in market analysis has also grown into a separate project: an analysis platform for the crypto market, now approaching launch, which aims to make market analysis and data-driven insights more accessible to crypto investors. Through Trendline, Venkat shares his own observations and analyses of the market, focusing on trends, market structure and the technical levels that may matter going forward.
Trendline is Kaupr's weekly technical analysis of Bitcoin and the crypto market, published every Monday. Each edition follows the market structure from week to week: which levels matter now, what has changed since the last edition, and what would need to happen for the broader picture to change.
Trendline is analysis, not investment advice, and is not a recommendation to buy or sell any asset. The views are the author's own.