


The cryptocurrency market has entered another challenging phase, with both Bitcoin and Ethereum extending their recent declines after breaking below important technical support levels. Bitcoin has moved below the $76,200 region and is now attempting to stabilise around $74,500, while Ethereum has fallen below $2,330, extending its decline by approximately 5% since the breakdown. Although both assets have experienced short-lived recovery attempts, neither has demonstrated convincing strength to reverse the broader downward structure.
Last week, the focus was on whether Bitcoin could establish a new support base around $76,200 following its breakdown below the previous consolidation range. Ethereum, meanwhile, was already showing signs of weakness after losing the rising trendline that had supported its recovery since May. One week later, both situations have deteriorated further. Bitcoin has moved below another important support level, while Ethereum has failed to reclaim the areas needed to restore its previous recovery structure.
Bitcoin's technical structure has weakened further over the past week. After initially finding support around $76,200, buyers eventually failed to defend the level, resulting in another move lower and shifting attention toward the $74,500 region.
The breakdown is particularly important because $76,200 had previously represented an area where buyers stepped in during the earlier decline. Once that support was lost, its technical significance changed. It now represents an important resistance area that Bitcoin needs to reclaim before the short-term outlook can begin to improve.
Looking at the broader chart, Bitcoin continues to trade within a descending channel defined by two downward-sloping trendlines. This structure has guided much of the recent correction, with successive lower highs illustrating the difficulty buyers have faced in regaining control.
The latest decline has pushed price toward the lower part of this formation, where buyers are now attempting to establish support. The immediate question is whether the $74,500 region can provide a foundation for another recovery attempt or whether the market is preparing for another move lower.
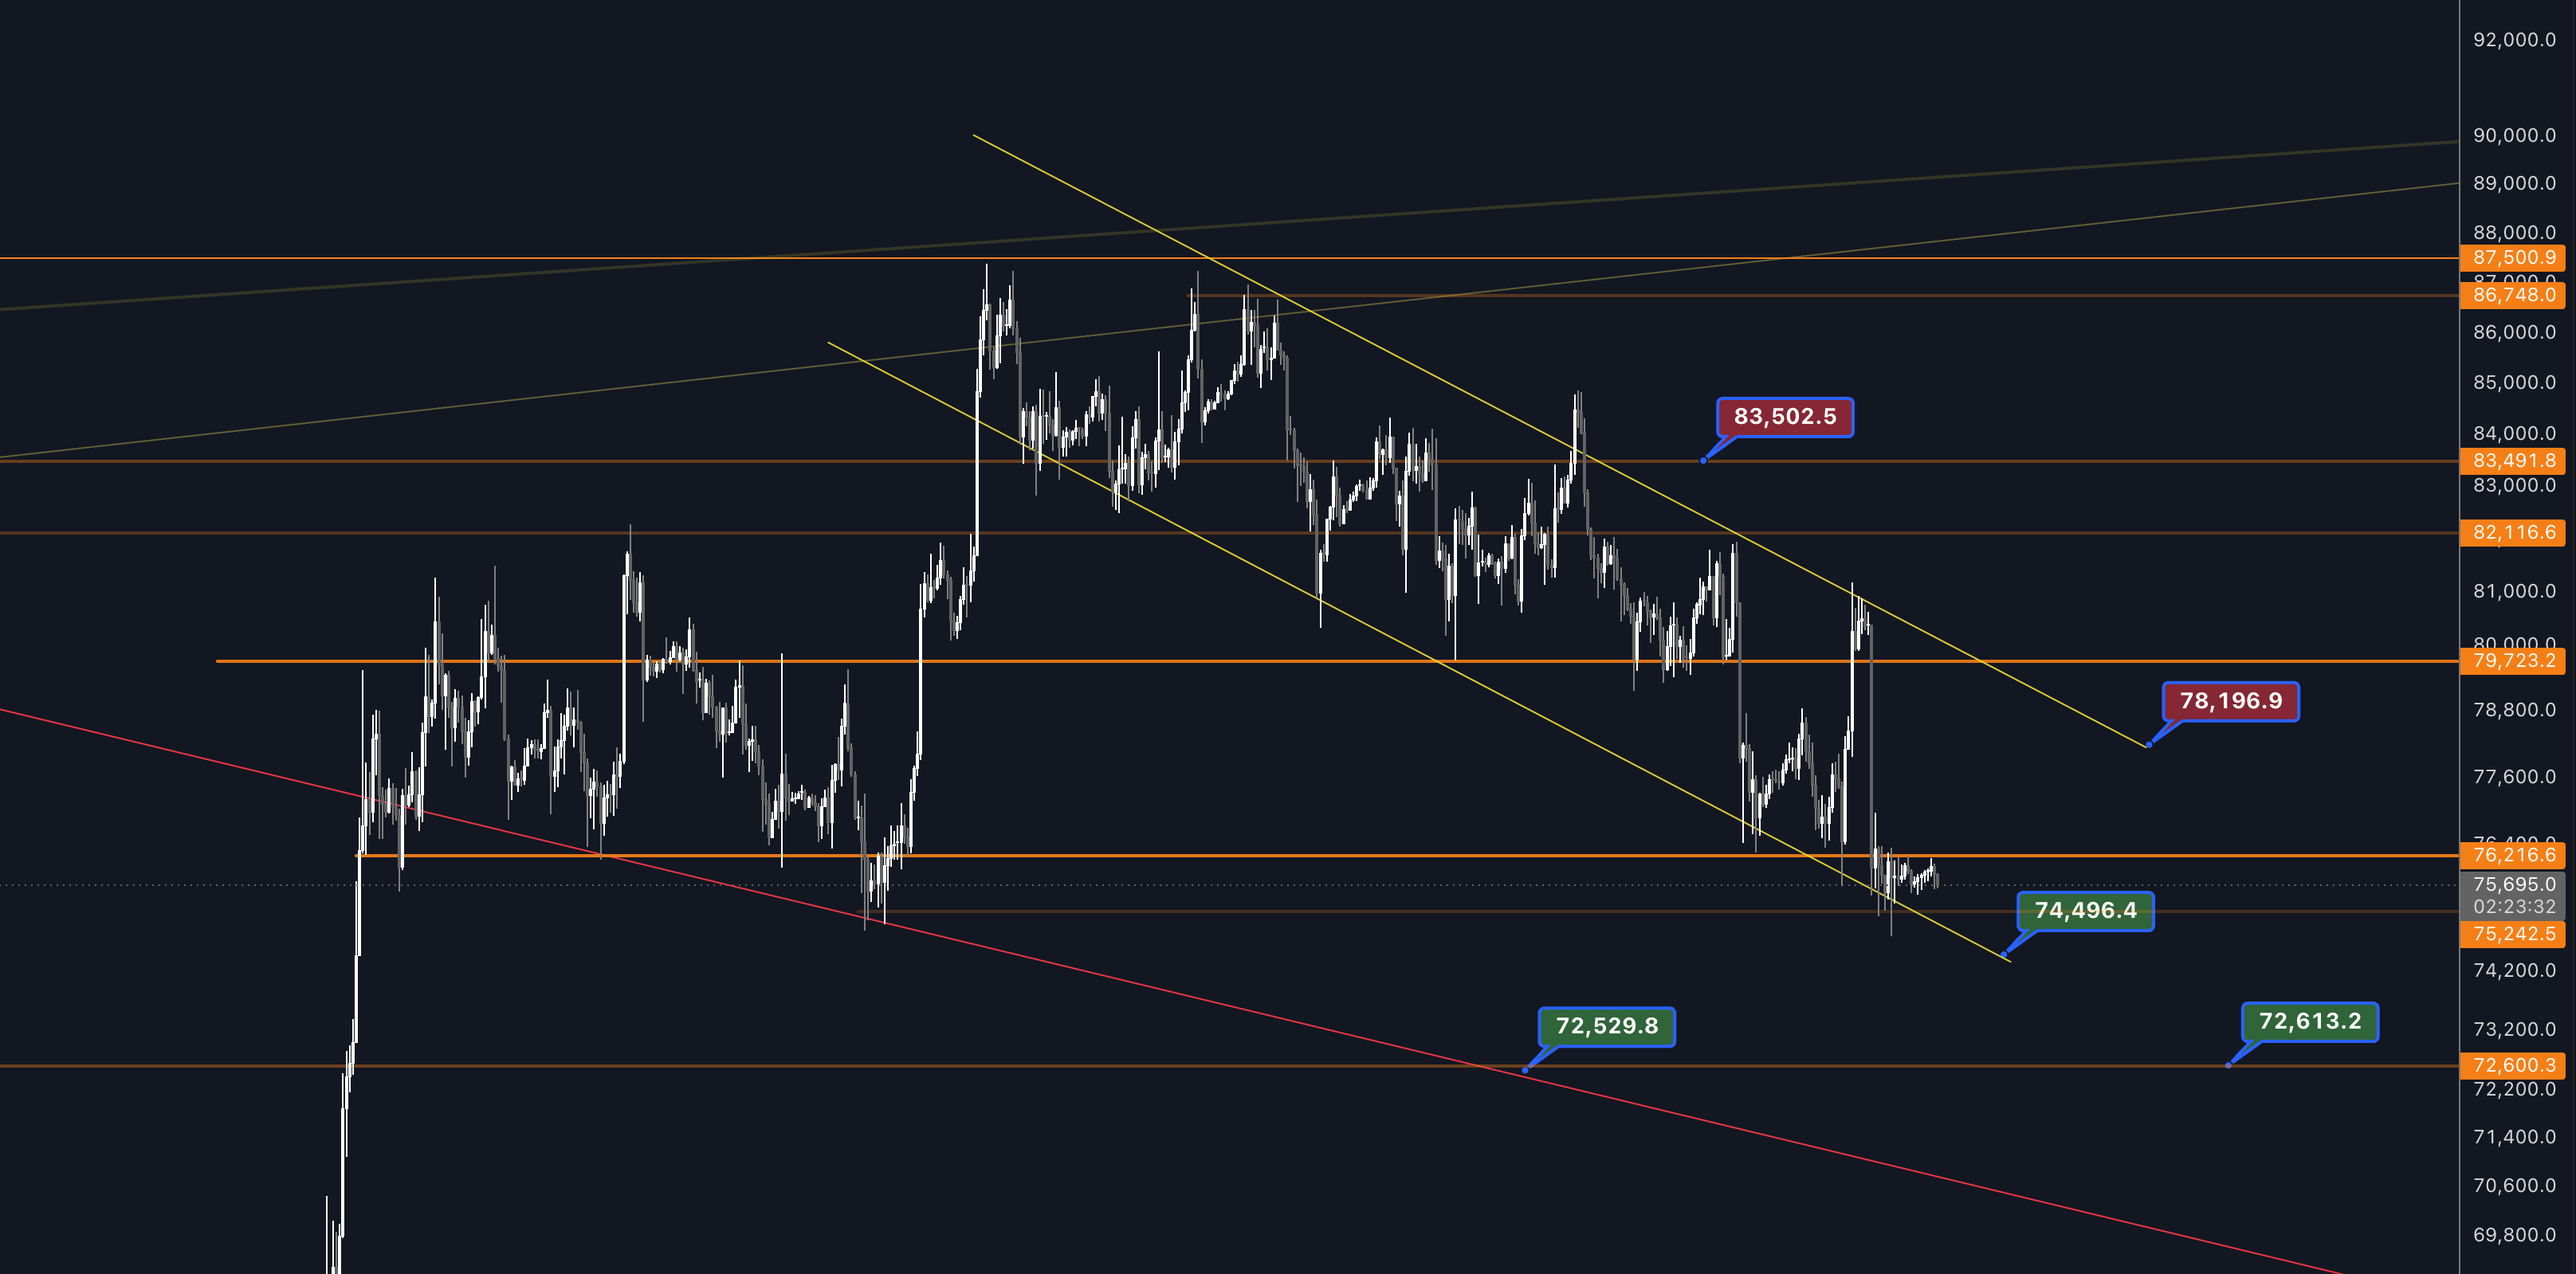
Following the latest breakdown, Bitcoin faces several important resistance levels on the way toward a potential recovery.
The first is approximately $76,200. A sustained move back above this level would be an encouraging development, suggesting that buyers are beginning to recover some of the ground lost during the latest decline.
However, reclaiming $76,200 would not necessarily indicate that the broader downtrend has ended. Further above, approximately $78,200 represents another important technical level, coinciding with the upper boundary of the descending channel.
A move above $78,200 would represent a more meaningful improvement, as it would suggest that price is beginning to challenge the descending structure that has restricted previous recovery attempts.
Beyond this region, approximately $83,500 remains a major resistance level. For now, the distinction between these levels is important: reclaiming $76,200 would be the first encouraging signal, while a move above $78,200 would provide stronger evidence that the descending structure is beginning to weaken.
On the downside, attention is now centred around approximately $74,500, where Bitcoin is attempting to stabilise following the latest sell-off.
If buyers manage to defend this region, Bitcoin could attempt to recover toward $76,200. A successful reclaim would improve the short-term outlook and potentially create room for a move toward the upper boundary of the descending channel.
However, a confirmed breakdown below $74,500 would shift attention toward the $74,500-72,600 region.
This area presents an interesting technical confluence. The horizontal support around $72,600 aligns closely with the longer-term descending trendline, currently intersecting near $72,530. The convergence of these two technical references makes the region particularly important if selling pressure continues.
A strong reaction from this area could provide the foundation for another recovery attempt. Nevertheless, a sustained breakdown would represent another deterioration in Bitcoin's technical position.
Ethereum's technical picture has also weakened considerably. In our previous analysis, we highlighted the importance of the rising trendline that had supported ETH's recovery since May. That structure has since been broken, and the subsequent price action has provided little evidence of a meaningful recovery.
The next important level was approximately $2,330, which had acted as horizontal support during the previous consolidation. Ethereum eventually moved below this region, triggering another wave of selling pressure.
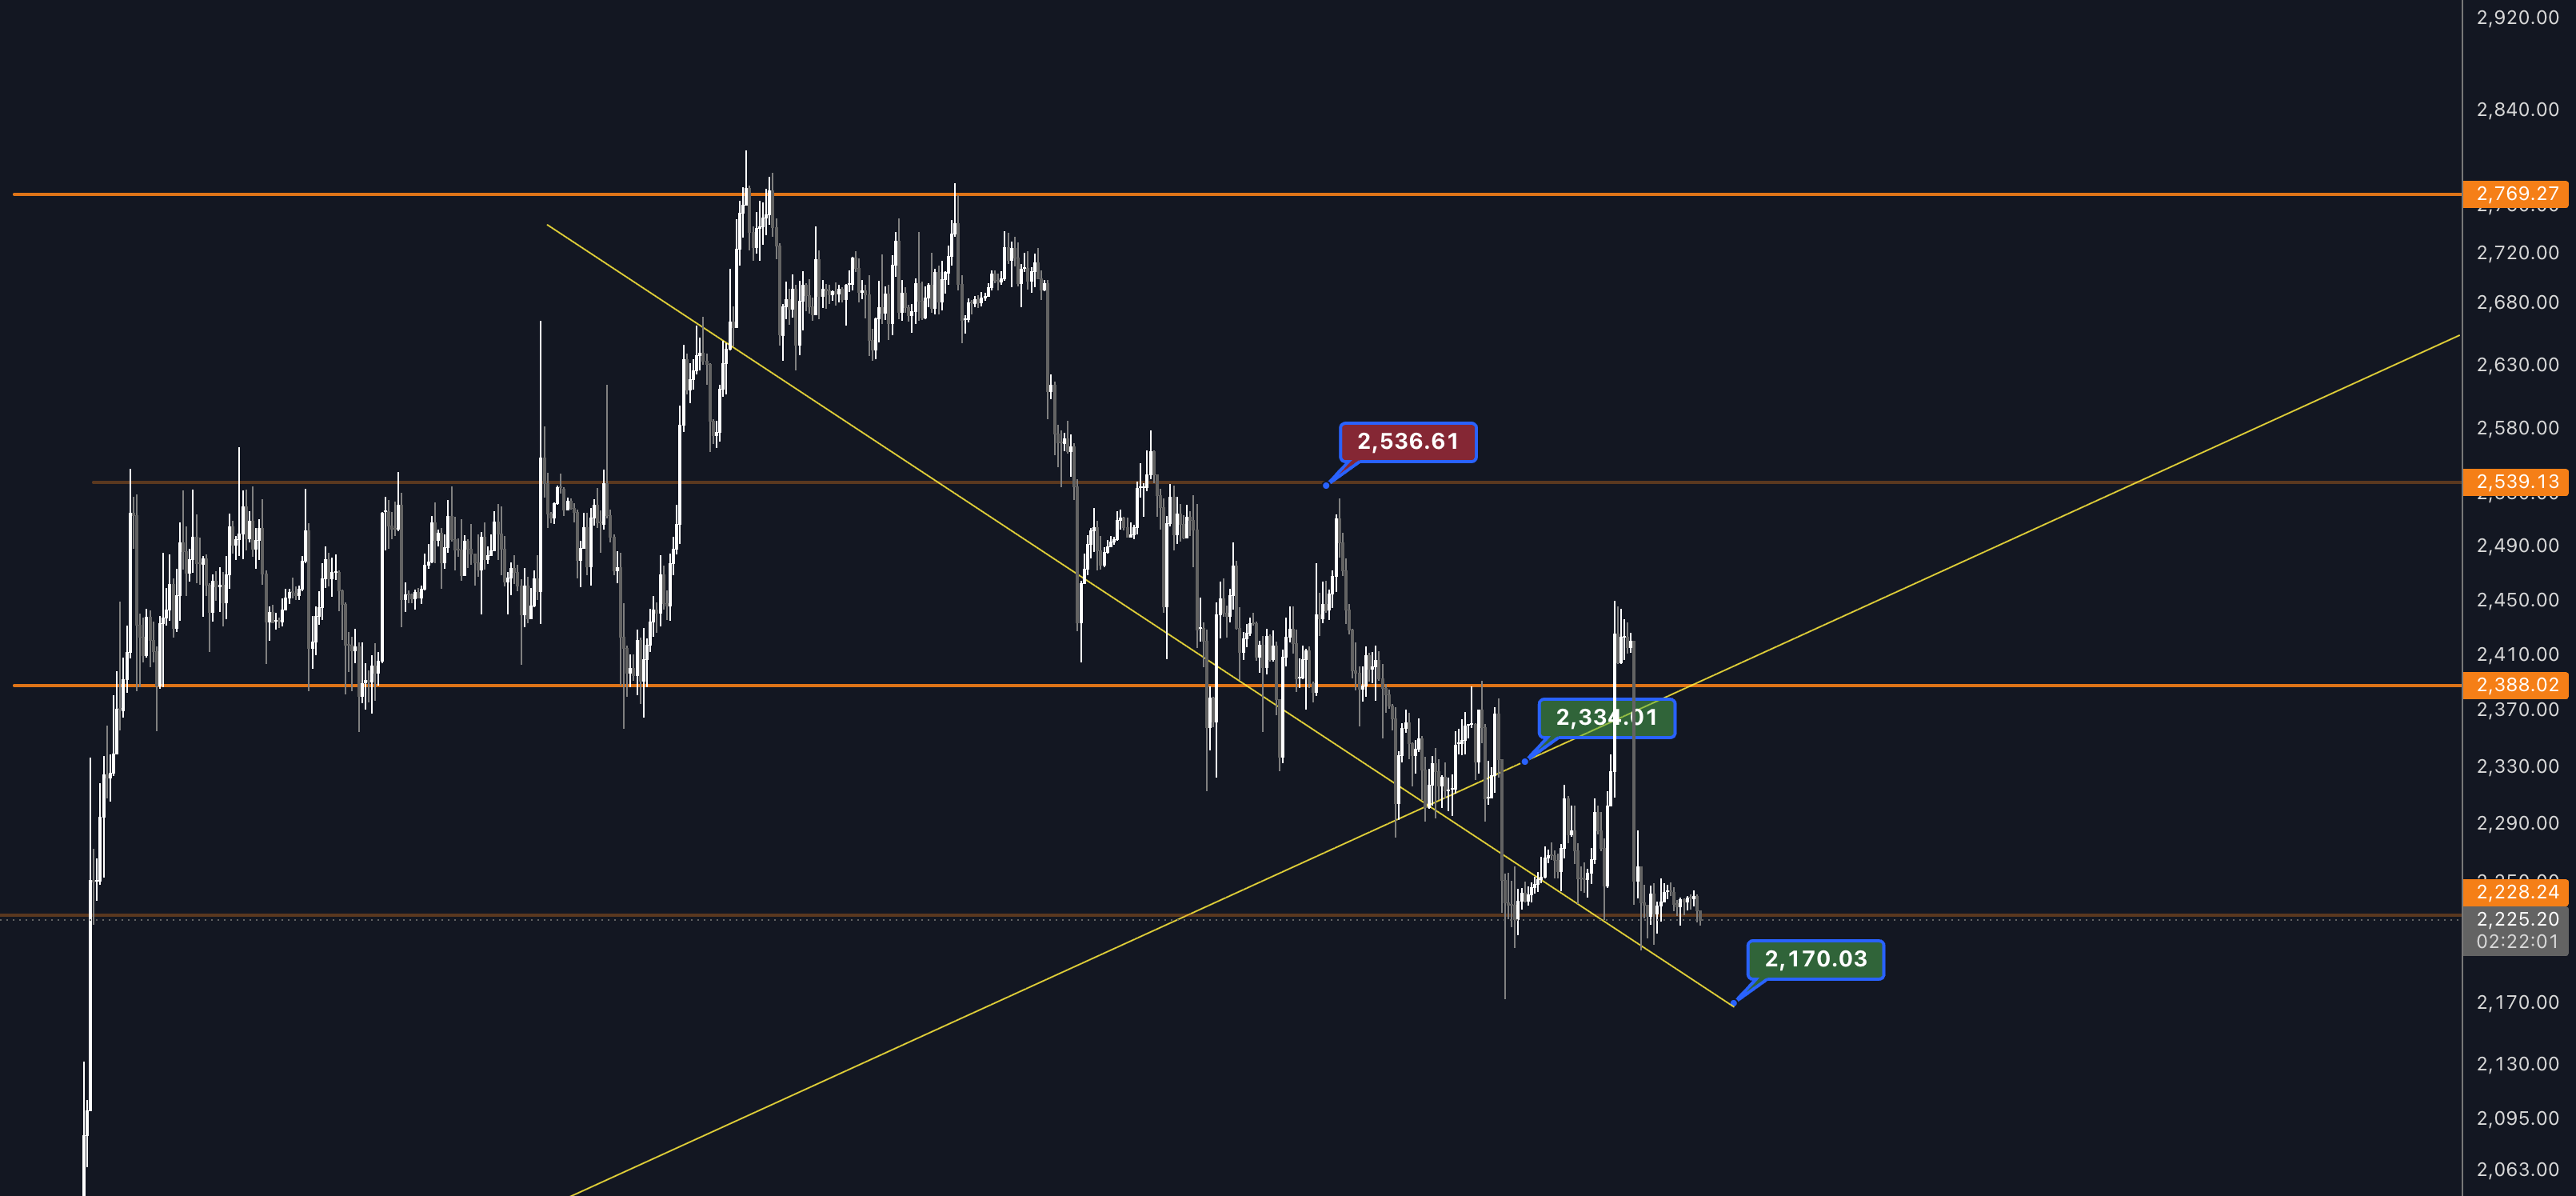
Since the breakdown, ETH has declined by approximately 5%, with price moving toward the $2,200 area.
The recent price action has been particularly volatile. Following the initial decline, Ethereum experienced a sharp upward reaction, briefly recovering toward higher levels before sellers returned and pushed price lower again.
Although these movements demonstrate that buyers are still attempting to defend the market, the recovery attempts have so far failed to establish a sustained move higher. Until Ethereum can reclaim its previous support levels, the broader downward structure remains intact.
With Ethereum trading around the $2,250 region, attention now turns toward approximately $2,180.
A sustained move below this area would weaken the technical picture further and suggest that the latest decline has not yet reached a convincing support level.
On the other hand, if buyers manage to defend this region, Ethereum could attempt another recovery toward the levels it recently lost.
The first important resistance remains around $2,334. This level is particularly significant because it previously acted as support and now represents an area Ethereum needs to reclaim to improve its short-term structure.
Beyond that, approximately $2,388 represents the next major resistance, followed by $2,539. A recovery above these levels would provide stronger evidence that buyers are regaining momentum and potentially open the door for a broader recovery.
Until then, Ethereum remains vulnerable to further downside.
The technical picture across Bitcoin and Ethereum has weakened further over the past week. Bitcoin has moved below $76,200, shifting attention toward $74,500 and potentially $72,500 if the current support fails. Ethereum has broken below $2,330 and extended its decline toward the $2,200 region.
Both assets have experienced sharp price movements followed by unsuccessful recovery attempts. While this increased volatility may reflect changing liquidity conditions and market positioning, it is difficult to attribute these movements to any specific cause based on price action alone.
This does not automatically mean that another significant decline is imminent. Markets can recover quickly after periods of heavy selling, particularly when buyers begin defending important technical areas. However, the burden of proof has shifted. Buyers now need to demonstrate that they can reclaim previously lost levels rather than simply defend the next available support.
For Bitcoin, the immediate focus is on approximately $74,500. Holding this region could provide the foundation for a recovery toward $76,200, followed by the descending channel resistance around $78,200. A confirmed breakdown below current support would bring the $72-500-72,600 region into focus.
For Ethereum, attention turns toward $2,180 on the downside. A recovery above $2,334 would be the first encouraging signal, while $2,388 represents the next major resistance. Beyond that, $2,539 remains an important level for a broader recovery attempt.
Last week, we were looking for signs that Bitcoin and Ethereum could establish support following their initial breakdowns. Instead, both assets have extended their declines, with previous support levels now acting as resistance.
The market is therefore facing a different question: have buyers found enough demand to stabilise prices around current levels, or are the latest rebounds simply temporary pauses within a broader correction?
For now, $74,500 in Bitcoin and $2,180 in Ethereum are the immediate downside levels I will be watching most closely. On the upside, reclaiming $76,200 in Bitcoin and $2,334 in Ethereum would provide the first signs that buyers are beginning to regain control.

Venkat Hrushikesa Varri has followed the crypto and financial markets for several years, with a particular interest in technical analysis and market development. He is part of the Kaupr team, covering Norwegian and international crypto conferences and contributing live coverage and content from the industry. His interest in market analysis has also grown into a separate project: an analysis platform for the crypto market, now approaching launch, which aims to make market analysis and data-driven insights more accessible to crypto investors. Through Trendline, Venkat shares his own observations and analyses of the market, focusing on trends, market structure and the technical levels that may matter going forward.
Trendline is Kaupr's weekly technical analysis of Bitcoin and the crypto market, published every Monday. Each edition follows the market structure from week to week: which levels matter now, what has changed since the last edition, and what would need to happen for the broader picture to change.
Trendline is analysis, not investment advice, and is not a recommendation to buy or sell any asset. The views are the author's own.